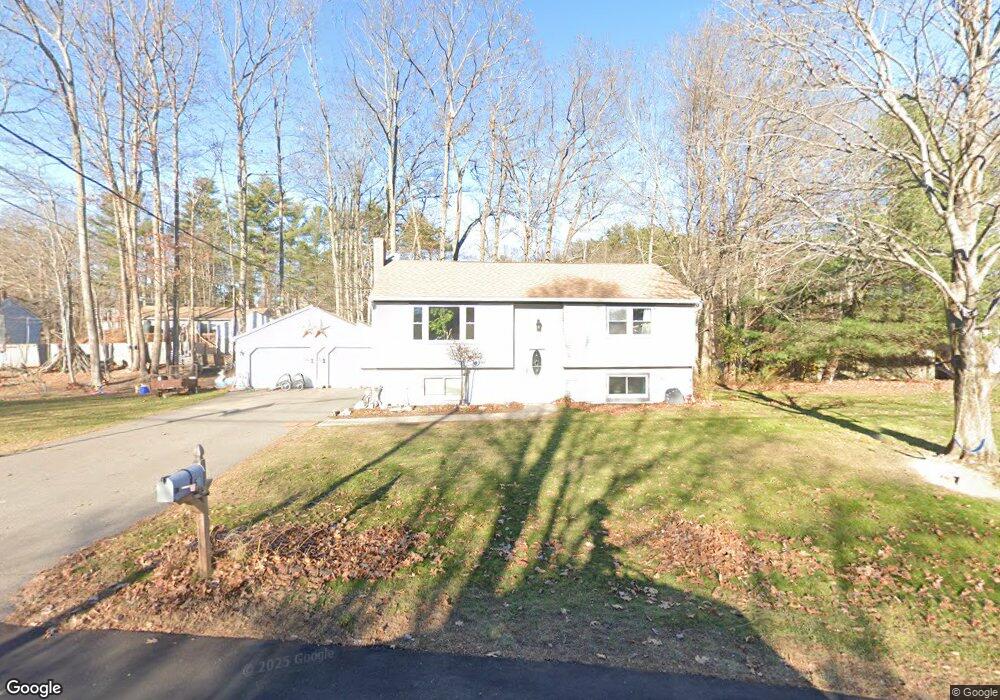
52 Pinewood Dr Topsham, ME 04086
Estimated Value: $338,000 - $654,000
3
Beds
1
Bath
1,954
Sq Ft
$228/Sq Ft
Est. Value
About This Home
This home is located at 52 Pinewood Dr, Topsham, ME 04086 and is currently estimated at $444,891, approximately $227 per square foot. 52 Pinewood Dr is a home located in Sagadahoc County with nearby schools including Mt Ararat High School, Harpswell Coastal Academy Divisions 2 and 3, and St John's Catholic School.
Ownership History
Date
Name
Owned For
Owner Type
Purchase Details
Closed on
Dec 28, 2010
Sold by
Oliver Mary E
Bought by
University Cu
Current Estimated Value
Purchase Details
Closed on
Jul 17, 2007
Sold by
Krog Randy A and Krog Heidi H D
Bought by
Oliver Mary E
Home Financials for this Owner
Home Financials are based on the most recent Mortgage that was taken out on this home.
Original Mortgage
$178,000
Interest Rate
6.48%
Mortgage Type
Unknown
Create a Home Valuation Report for This Property
The Home Valuation Report is an in-depth analysis detailing your home's value as well as a comparison with similar homes in the area
Home Values in the Area
Average Home Value in this Area
Purchase History
| Date | Buyer | Sale Price | Title Company |
|---|---|---|---|
| University Cu | -- | -- | |
| Oliver Mary E | -- | -- |
Source: Public Records
Mortgage History
| Date | Status | Borrower | Loan Amount |
|---|---|---|---|
| Previous Owner | Oliver Mary E | $178,000 |
Source: Public Records
Tax History
| Year | Tax Paid | Tax Assessment Tax Assessment Total Assessment is a certain percentage of the fair market value that is determined by local assessors to be the total taxable value of land and additions on the property. | Land | Improvement |
|---|---|---|---|---|
| 2025 | $3,681 | $287,600 | $60,400 | $227,200 |
| 2024 | $3,539 | $283,100 | $55,900 | $227,200 |
| 2023 | $3,358 | $247,300 | $53,200 | $194,100 |
| 2022 | $3,177 | $220,300 | $51,500 | $168,800 |
| 2021 | $3,044 | $191,800 | $47,200 | $144,600 |
| 2020 | $3,109 | $174,100 | $47,200 | $126,900 |
| 2019 | $3,081 | $160,900 | $47,200 | $113,700 |
| 2018 | $2,898 | $154,700 | $42,100 | $112,600 |
| 2017 | $2,803 | $154,700 | $42,100 | $112,600 |
| 2016 | $2,700 | $150,100 | $42,100 | $108,000 |
| 2015 | $2,611 | $145,400 | $42,100 | $103,300 |
| 2014 | $2,461 | $142,000 | $42,100 | $99,900 |
| 2013 | $2,364 | $142,000 | $42,100 | $99,900 |
Source: Public Records
Map
Nearby Homes
Your Personal Tour Guide
Ask me questions while you tour the home.