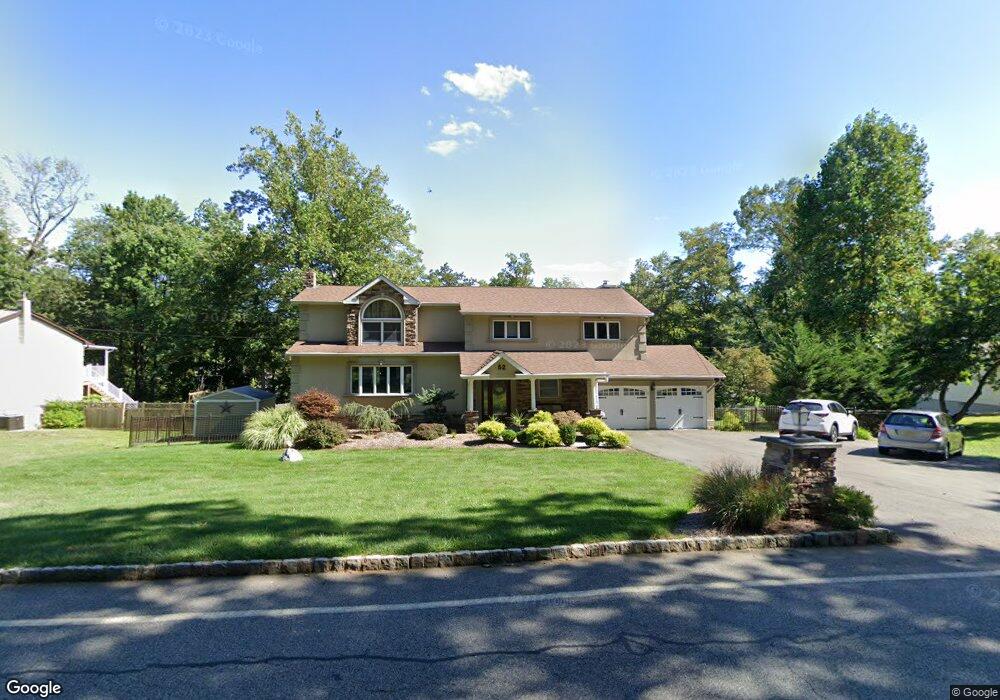
52 Radtke Rd Randolph, NJ 07869
Estimated Value: $872,000 - $982,000
--
Bed
--
Bath
3,111
Sq Ft
$299/Sq Ft
Est. Value
About This Home
This home is located at 52 Radtke Rd, Randolph, NJ 07869 and is currently estimated at $929,885, approximately $298 per square foot. 52 Radtke Rd is a home located in Morris County with nearby schools including Randolph High School, Randolph Middle School, and Apple Montessori Schools and Camps - Randolph.
Ownership History
Date
Name
Owned For
Owner Type
Purchase Details
Closed on
Jun 12, 1997
Sold by
Nicholasi Paul and Nicholasi Julie
Bought by
Iemmello Anthony A and Iemmello Mary Jo
Current Estimated Value
Home Financials for this Owner
Home Financials are based on the most recent Mortgage that was taken out on this home.
Original Mortgage
$214,600
Outstanding Balance
$30,418
Interest Rate
7.87%
Estimated Equity
$899,467
Create a Home Valuation Report for This Property
The Home Valuation Report is an in-depth analysis detailing your home's value as well as a comparison with similar homes in the area
Home Values in the Area
Average Home Value in this Area
Purchase History
| Date | Buyer | Sale Price | Title Company |
|---|---|---|---|
| Iemmello Anthony A | $270,000 | Lawyers Title Insurance Corp |
Source: Public Records
Mortgage History
| Date | Status | Borrower | Loan Amount |
|---|---|---|---|
| Open | Iemmello Anthony A | $214,600 |
Source: Public Records
Tax History Compared to Growth
Tax History
| Year | Tax Paid | Tax Assessment Tax Assessment Total Assessment is a certain percentage of the fair market value that is determined by local assessors to be the total taxable value of land and additions on the property. | Land | Improvement |
|---|---|---|---|---|
| 2025 | $16,788 | $593,000 | $192,700 | $400,300 |
| 2024 | $16,367 | $593,000 | $192,700 | $400,300 |
| 2023 | $16,367 | $593,000 | $192,700 | $400,300 |
| 2022 | $15,726 | $593,000 | $192,700 | $400,300 |
| 2021 | $15,726 | $593,000 | $192,700 | $400,300 |
| 2020 | $15,566 | $593,000 | $192,700 | $400,300 |
| 2019 | $15,388 | $593,000 | $192,700 | $400,300 |
| 2018 | $15,193 | $593,000 | $192,700 | $400,300 |
| 2017 | $15,003 | $593,000 | $192,700 | $400,300 |
| 2016 | $12,942 | $353,600 | $129,400 | $224,200 |
| 2015 | $12,786 | $353,600 | $129,400 | $224,200 |
| 2014 | $12,588 | $353,600 | $129,400 | $224,200 |
Source: Public Records
Map
Nearby Homes