52 Read Dr Hanover, MA 02339
Estimated Value: $788,969 - $1,057,000
4
Beds
2
Baths
2,395
Sq Ft
$379/Sq Ft
Est. Value
About This Home
This home is located at 52 Read Dr, Hanover, MA 02339 and is currently estimated at $906,992, approximately $378 per square foot. 52 Read Dr is a home located in Plymouth County with nearby schools including Hanover High School, Cadence Academy Preschool - Hanover, and The Master's Academy.
Ownership History
Date
Name
Owned For
Owner Type
Purchase Details
Closed on
Feb 24, 2016
Sold by
Karvelis James A and Karvelis Leah S
Bought by
Karvelis James A and Karvelis Leah S
Current Estimated Value
Home Financials for this Owner
Home Financials are based on the most recent Mortgage that was taken out on this home.
Original Mortgage
$367,750
Outstanding Balance
$293,657
Interest Rate
3.92%
Mortgage Type
New Conventional
Estimated Equity
$613,335
Purchase Details
Closed on
Jul 31, 2015
Sold by
Sullivan Christopher J and Sullivan Patricia M
Bought by
Karvelis James A and Karvelis Leah S
Home Financials for this Owner
Home Financials are based on the most recent Mortgage that was taken out on this home.
Original Mortgage
$368,000
Interest Rate
3.97%
Mortgage Type
New Conventional
Purchase Details
Closed on
Nov 8, 2004
Sold by
Spear Robert B and Spear Alice J
Bought by
Sullivan Christopher J and Sullivan Patricia M
Create a Home Valuation Report for This Property
The Home Valuation Report is an in-depth analysis detailing your home's value as well as a comparison with similar homes in the area
Home Values in the Area
Average Home Value in this Area
Purchase History
| Date | Buyer | Sale Price | Title Company |
|---|---|---|---|
| Karvelis James A | -- | -- | |
| Karvelis James A | $460,000 | -- | |
| Sullivan Christopher J | $515,000 | -- |
Source: Public Records
Mortgage History
| Date | Status | Borrower | Loan Amount |
|---|---|---|---|
| Open | Karvelis James A | $367,750 | |
| Previous Owner | Karvelis James A | $368,000 |
Source: Public Records
Tax History
| Year | Tax Paid | Tax Assessment Tax Assessment Total Assessment is a certain percentage of the fair market value that is determined by local assessors to be the total taxable value of land and additions on the property. | Land | Improvement |
|---|---|---|---|---|
| 2025 | $8,678 | $702,700 | $271,100 | $431,600 |
| 2024 | $7,362 | $573,400 | $246,400 | $327,000 |
| 2023 | $7,735 | $573,400 | $246,400 | $327,000 |
| 2022 | $8,744 | $573,400 | $246,400 | $327,000 |
| 2021 | $8,820 | $540,100 | $224,100 | $316,000 |
| 2020 | $8,754 | $536,700 | $224,100 | $312,600 |
| 2019 | $7,711 | $469,900 | $224,100 | $245,800 |
| 2018 | $7,572 | $465,100 | $224,100 | $241,000 |
| 2017 | $7,062 | $427,500 | $212,900 | $214,600 |
| 2016 | $6,967 | $413,200 | $193,600 | $219,600 |
| 2015 | $6,510 | $403,100 | $193,600 | $209,500 |
Source: Public Records
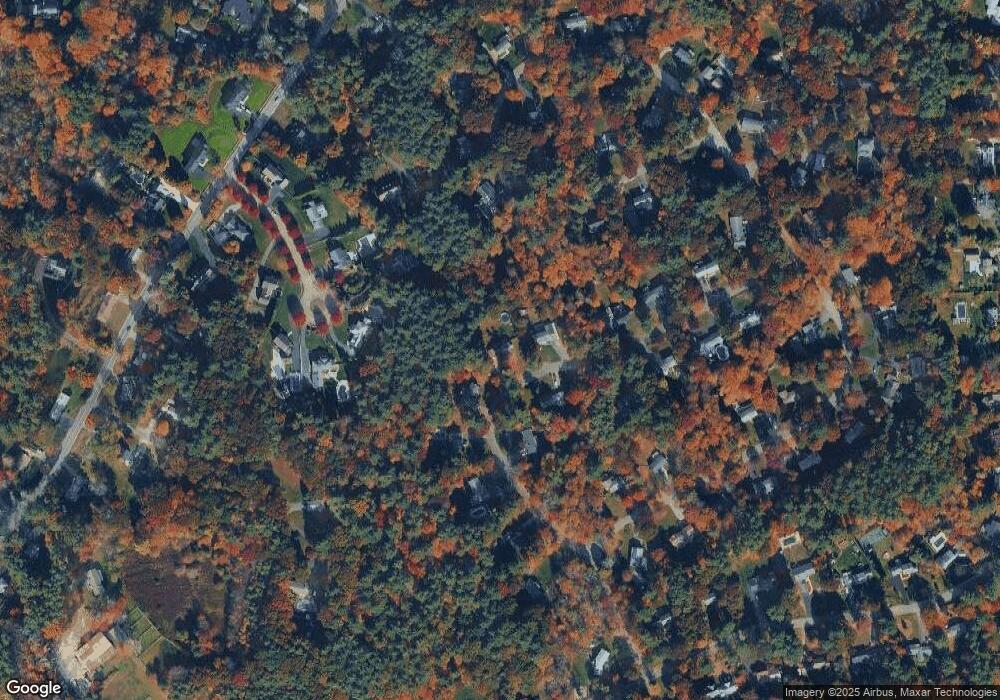
Map
Nearby Homes
Your Personal Tour Guide
Ask me questions while you tour the home.