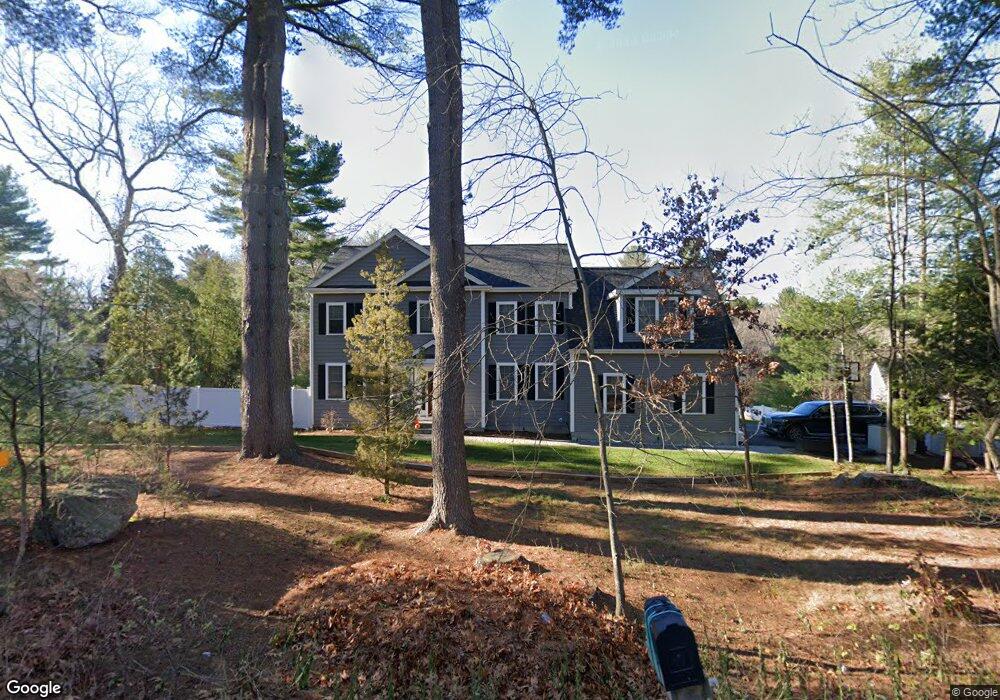
52 Rice Rd Unit 52 Wayland, MA 01778
Estimated Value: $1,815,538 - $2,281,000
2
Beds
1
Bath
948
Sq Ft
$2,087/Sq Ft
Est. Value
About This Home
This home is located at 52 Rice Rd Unit 52, Wayland, MA 01778 and is currently estimated at $1,978,385, approximately $2,086 per square foot. 52 Rice Rd Unit 52 is a home located in Middlesex County with nearby schools including Wayland High School, Veritas Christian Academy, and The Rivers School.
Ownership History
Date
Name
Owned For
Owner Type
Purchase Details
Closed on
Dec 21, 2017
Sold by
Greenaway Thomas D and Greenaway Sarah M
Bought by
Wayland Town Of
Current Estimated Value
Purchase Details
Closed on
Nov 1, 1993
Sold by
Benjamin Peter E
Bought by
Belyaev Alex and Belyaev Svetlana
Create a Home Valuation Report for This Property
The Home Valuation Report is an in-depth analysis detailing your home's value as well as a comparison with similar homes in the area
Home Values in the Area
Average Home Value in this Area
Purchase History
| Date | Buyer | Sale Price | Title Company |
|---|---|---|---|
| Wayland Town Of | -- | -- | |
| Wayland Town Of | -- | -- | |
| Belyaev Alex | $235,000 | -- |
Source: Public Records
Mortgage History
| Date | Status | Borrower | Loan Amount |
|---|---|---|---|
| Previous Owner | Belyaev Alex | $375,000 | |
| Previous Owner | Belyaev Alex | $179,300 |
Source: Public Records
Tax History Compared to Growth
Tax History
| Year | Tax Paid | Tax Assessment Tax Assessment Total Assessment is a certain percentage of the fair market value that is determined by local assessors to be the total taxable value of land and additions on the property. | Land | Improvement |
|---|---|---|---|---|
| 2025 | $26,659 | $1,705,600 | $502,900 | $1,202,700 |
| 2024 | $25,257 | $1,627,400 | $478,900 | $1,148,500 |
| 2023 | $23,533 | $1,413,400 | $435,400 | $978,000 |
| 2022 | $23,505 | $1,280,900 | $360,600 | $920,300 |
| 2021 | $23,115 | $1,248,100 | $327,800 | $920,300 |
| 2020 | $22,331 | $1,257,400 | $327,800 | $929,600 |
| 2019 | $13,308 | $728,000 | $312,300 | $415,700 |
| 2018 | $9,240 | $512,500 | $403,300 | $109,200 |
| 2017 | $8,958 | $493,800 | $383,800 | $110,000 |
| 2016 | $8,408 | $484,900 | $376,600 | $108,300 |
| 2015 | $8,623 | $468,900 | $376,600 | $92,300 |
Source: Public Records
Map
Nearby Homes
- 17 Smokey Hill Rd
- 125 Woodridge Rd
- 5 Brook Trail Rd
- 11 White Pine Knoll Rd
- 12 Cutting Cross Way
- 106 Willow Brook Dr Unit 106
- 12 Nancy Rd
- 6 Steepletree Ln
- 1 Winter St
- 262 Cochituate Rd
- 260 Cochituate Rd
- 606 Wisteria Way
- 1601 Wisteria Way
- 1605 Wisteria Way
- 208 Cochituate Rd
- 35 Snake Brook Rd
- 7 Fox Hollow
- 8 Fox Hollow
- 1004 Wisteria Way
- 3 Keith Rd