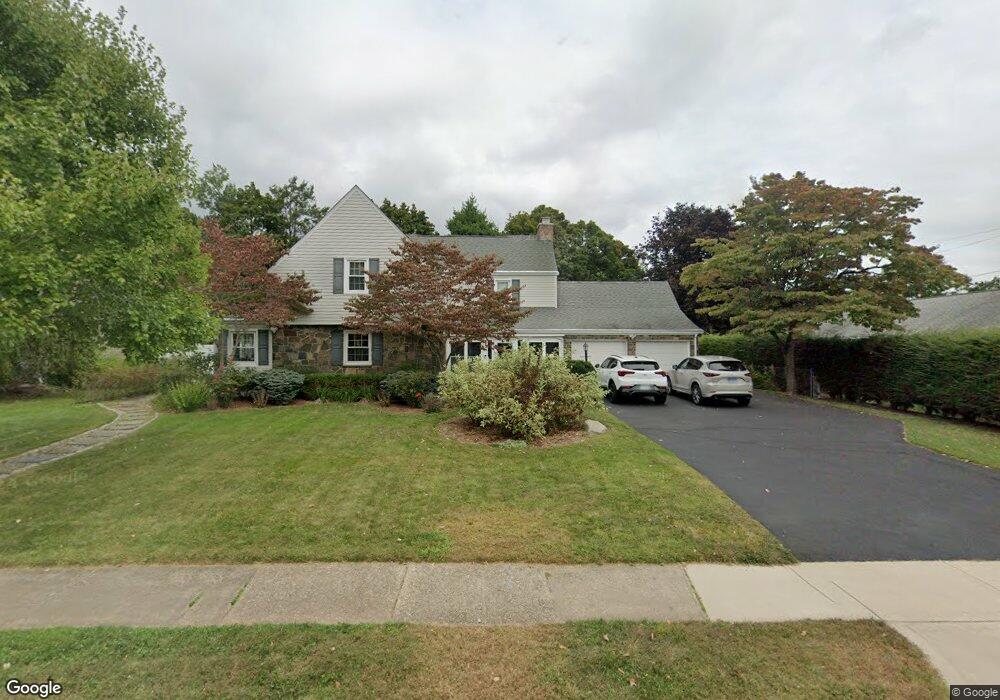
52 Rockledge Dr West Hartford, CT 06107
Estimated Value: $769,000 - $855,000
4
Beds
3
Baths
2,843
Sq Ft
$282/Sq Ft
Est. Value
About This Home
This home is located at 52 Rockledge Dr, West Hartford, CT 06107 and is currently estimated at $801,580, approximately $281 per square foot. 52 Rockledge Dr is a home located in Hartford County with nearby schools including Webster Hill School, Sedgwick Middle School, and Conard High School.
Ownership History
Date
Name
Owned For
Owner Type
Purchase Details
Closed on
Apr 22, 2024
Sold by
Lancor Steven A and Lancor Ann M
Bought by
Salvatore Gabriella M and Schlagel Michael K
Current Estimated Value
Home Financials for this Owner
Home Financials are based on the most recent Mortgage that was taken out on this home.
Original Mortgage
$552,500
Outstanding Balance
$543,429
Interest Rate
6.38%
Mortgage Type
Purchase Money Mortgage
Estimated Equity
$258,151
Purchase Details
Closed on
Oct 28, 2005
Sold by
Mccarthy Robert N and Mccarthy Maureen L
Bought by
Lancor Steven A and Lancor Ann Marie
Purchase Details
Closed on
Feb 2, 1996
Sold by
Joy David and Joy Barbara
Bought by
Capodicasa Susan and Capodicasa John
Purchase Details
Closed on
Sep 30, 1994
Sold by
Zuraski Frank Est
Bought by
Kudyba Zygmunt and Kudyba Aleksandra
Create a Home Valuation Report for This Property
The Home Valuation Report is an in-depth analysis detailing your home's value as well as a comparison with similar homes in the area
Home Values in the Area
Average Home Value in this Area
Purchase History
| Date | Buyer | Sale Price | Title Company |
|---|---|---|---|
| Salvatore Gabriella M | $725,000 | None Available | |
| Salvatore Gabriella M | $725,000 | None Available | |
| Lancor Steven A | $430,000 | -- | |
| Lancor Steven A | $430,000 | -- | |
| Capodicasa Susan | $182,000 | -- | |
| Capodicasa Susan | $182,000 | -- | |
| Kudyba Zygmunt | $173,500 | -- | |
| Kudyba Zygmunt | $173,500 | -- |
Source: Public Records
Mortgage History
| Date | Status | Borrower | Loan Amount |
|---|---|---|---|
| Open | Salvatore Gabriella M | $552,500 | |
| Closed | Salvatore Gabriella M | $552,500 | |
| Previous Owner | Kudyba Zygmunt | $100,000 | |
| Previous Owner | Kudyba Zygmunt | $352,000 |
Source: Public Records
Tax History Compared to Growth
Tax History
| Year | Tax Paid | Tax Assessment Tax Assessment Total Assessment is a certain percentage of the fair market value that is determined by local assessors to be the total taxable value of land and additions on the property. | Land | Improvement |
|---|---|---|---|---|
| 2025 | $15,209 | $339,640 | $119,070 | $220,570 |
| 2024 | $14,384 | $339,640 | $119,070 | $220,570 |
| 2023 | $13,898 | $339,640 | $119,070 | $220,570 |
| 2022 | $13,817 | $339,640 | $119,070 | $220,570 |
| 2021 | $13,641 | $321,580 | $94,570 | $227,010 |
| 2020 | $13,123 | $313,950 | $88,410 | $225,540 |
| 2019 | $13,123 | $313,950 | $88,410 | $225,540 |
| 2018 | $12,872 | $313,950 | $88,410 | $225,540 |
| 2017 | $12,885 | $313,950 | $88,410 | $225,540 |
| 2016 | $10,075 | $255,010 | $67,480 | $187,530 |
| 2015 | $9,769 | $255,010 | $67,480 | $187,530 |
| 2014 | $9,530 | $255,010 | $67,480 | $187,530 |
Source: Public Records
Map
Nearby Homes
- 96 Bentwood Rd
- 394 Trout Brook Dr
- 39 Pheasant Hill Dr
- 61 Woodmere Rd
- 741 Quaker Ln S
- 43 Spring Ln
- 17 Parkview Rd
- 1640 Boulevard
- 204 Trout Brook Dr
- 101 Englewood Ave
- 422 S Main St
- 395 Park Rd
- 39 Cortland St
- 50 Acadia St
- 25 Ellsworth Rd
- 69 Saint Augustine St
- 34 Sandhurst Dr
- 51 Lemay St
- 50 Tunxis Rd
- 90 Park Place Cir Unit 90
- 56 Rockledge Dr
- 99 Webster Hill Blvd
- 58 Rockledge Dr
- 55 Rumford St
- 53 Rumford St
- 59 Rumford St
- 49 Rumford St
- 53 Rockledge Dr
- 49 Rockledge Dr
- 62 Rockledge Dr
- 57 Rockledge Dr
- 100 Webster Hill Blvd
- 59 Rockledge Dr
- 66 Rockledge Dr
- 67 Rumford St
- 108 Webster Hill Blvd
- 63 Rockledge Dr
- 92 Webster Hill Blvd
- 58 Rumford St
- 54 Rumford St