
Landlord's Agent in 2017
Liz Carlson
Coldwell Banker Realty - Marblehead
(781) 476-0780
4 in this area
28 Total Sales
Estimated Value: $407,000 - $470,000
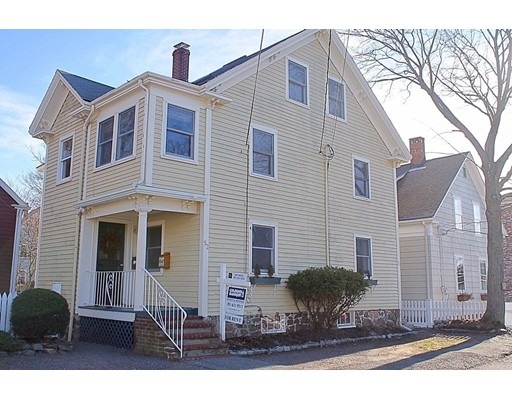
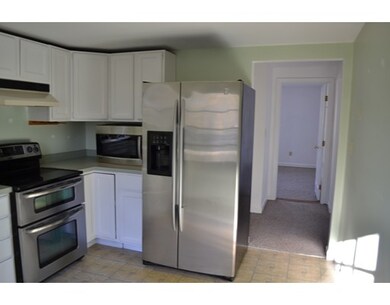
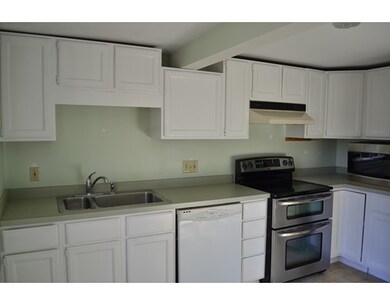
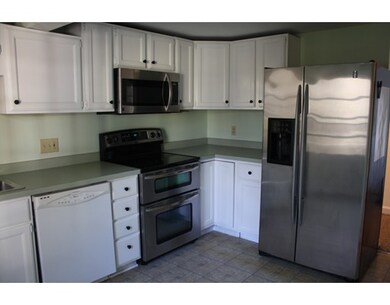
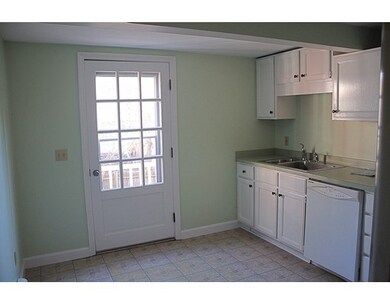
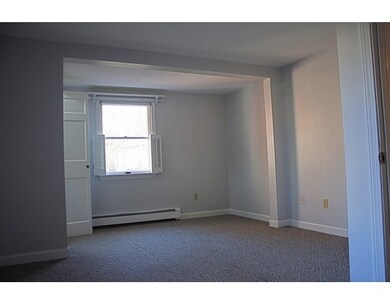
Location, location, location! Close to town, shops, restaurants, and beaches, this cozy first floor 2 bedroom unit has parking for one car, a bright freshly painted kitchen and a flexible floor plan. Pets are negotiable.
Last Agent to Rent the Property
Coldwell Banker Realty - Marblehead Listed on: 11/29/2016
Last Renter's Agent
Cynthia Kilbarger
RE/MAX 360 License #454003279
Home Type
Other
Est. Annual Taxes
$3,347
Year Built
1890
Lot Details
0
| Date | Buyer | Sale Price | Title Company |
|---|---|---|---|
| Spurr Janet E | $242,000 | -- |
| Date | Status | Borrower | Loan Amount |
|---|---|---|---|
| Open | Spurr Janet E | $229,900 |
| Date | Event | Price | List to Sale | Price per Sq Ft | Prior Sale |
|---|---|---|---|---|---|
| 02/28/2017 02/28/17 | Rented | $1,500 | 0.0% | -- | |
| 02/20/2017 02/20/17 | Price Changed | $1,500 | 0.0% | $2 / Sq Ft | |
| 02/20/2017 02/20/17 | For Rent | $1,500 | -6.3% | -- | |
| 02/15/2017 02/15/17 | Off Market | $1,600 | -- | -- | |
| 11/29/2016 11/29/16 | For Rent | $1,600 | 0.0% | -- | |
| 11/18/2016 11/18/16 | Sold | $229,000 | -4.2% | $280 / Sq Ft | View Prior Sale |
| 10/28/2016 10/28/16 | Pending | -- | -- | -- | |
| 10/17/2016 10/17/16 | Price Changed | $239,000 | -4.0% | $293 / Sq Ft | |
| 10/06/2016 10/06/16 | Price Changed | $249,000 | -2.4% | $305 / Sq Ft | |
| 09/12/2016 09/12/16 | For Sale | $255,000 | -- | $312 / Sq Ft |
| Year | Tax Paid | Tax Assessment Tax Assessment Total Assessment is a certain percentage of the fair market value that is determined by local assessors to be the total taxable value of land and additions on the property. | Land | Improvement |
|---|---|---|---|---|
| 2025 | $3,347 | $369,800 | $0 | $369,800 |
| 2024 | $3,315 | $370,000 | $0 | $370,000 |
| 2023 | $3,066 | $306,600 | $0 | $306,600 |
| 2022 | $2,943 | $279,800 | $0 | $279,800 |
| 2021 | $2,877 | $276,100 | $0 | $276,100 |
| 2020 | $2,768 | $266,400 | $0 | $266,400 |
| 2019 | $2,558 | $238,200 | $0 | $238,200 |
| 2018 | $2,297 | $208,400 | $0 | $208,400 |
| 2017 | $2,147 | $195,000 | $0 | $195,000 |
| 2016 | $1,992 | $179,500 | $0 | $179,500 |
| 2015 | $2,014 | $181,800 | $0 | $181,800 |
| 2014 | $1,933 | $174,300 | $0 | $174,300 |
Landlord's Agent in 2017
Liz Carlson
Coldwell Banker Realty - Marblehead
(781) 476-0780
4 in this area
28 Total Sales
C
Tenant's Agent in 2017
Cynthia Kilbarger
RE/MAX
P
Seller's Agent in 2016
Patricia Cohen
Coldwell Banker Realty - Manchester
1 Total Sale
Source: MLS Property Information Network (MLS PIN)
MLS Number: 72096908
APN: MARB-000110-000050-000001
Disclaimer: Certain information contained herein is derived from information provided by parties other than Homes.com. All information provided is deemed reliable, but is not guaranteed to be accurate and should be independently verified.
![]() The property listing data and information, or the Images, set forth herein were provided to MLS Property Information Network, Inc. from third party sources, including sellers, lessors and public records, and were compiled by MLS Property Information Network, Inc. The property listing data and information, and the Images, are for the personal, non-commercial use of consumers having a good faith interest in purchasing or leasing listed properties of the type displayed to them and may not be used for any purpose other than to identify prospective properties which such consumers may have a good faith interest in purchasing or leasing. MLS Property Information Network, Inc. and its subscribers disclaim any and all representations and warranties as to the accuracy of the property listing data and information, or as to the accuracy of any of the Images, set forth herein.
The property listing data and information, or the Images, set forth herein were provided to MLS Property Information Network, Inc. from third party sources, including sellers, lessors and public records, and were compiled by MLS Property Information Network, Inc. The property listing data and information, and the Images, are for the personal, non-commercial use of consumers having a good faith interest in purchasing or leasing listed properties of the type displayed to them and may not be used for any purpose other than to identify prospective properties which such consumers may have a good faith interest in purchasing or leasing. MLS Property Information Network, Inc. and its subscribers disclaim any and all representations and warranties as to the accuracy of the property listing data and information, or as to the accuracy of any of the Images, set forth herein.