Estimated Value: $401,000 - $413,000
Studio
--
Bath
1,060
Sq Ft
$382/Sq Ft
Est. Value
About This Home
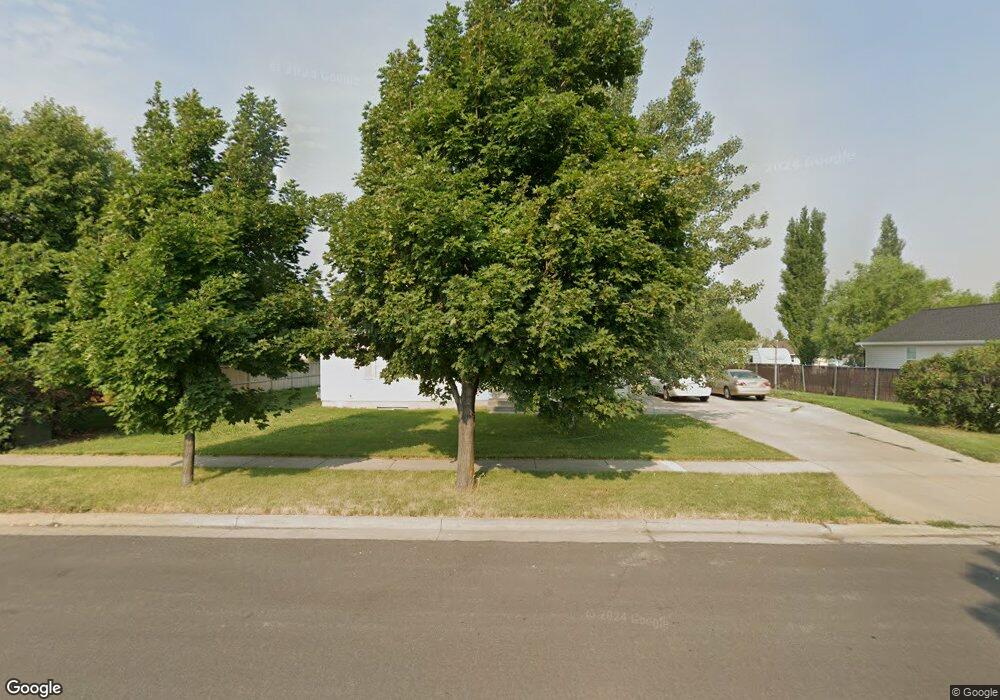
This home is located at 52 S 1350 E, Hyrum, UT 84319 and is currently estimated at $405,101, approximately $382 per square foot. 52 S 1350 E is a home with nearby schools including Canyon School, South Cache Middle School, and Mountain Crest High School.
Ownership History
Date
Name
Owned For
Owner Type
Purchase Details
Closed on
Jan 11, 2002
Sold by
Greyeye Enterprises Inc
Bought by
Smith Mike George and Smith Lisa Clawson
Current Estimated Value
Home Financials for this Owner
Home Financials are based on the most recent Mortgage that was taken out on this home.
Original Mortgage
$111,900
Outstanding Balance
$45,151
Interest Rate
7.01%
Mortgage Type
Seller Take Back
Estimated Equity
$359,950
Purchase Details
Closed on
Feb 2, 2001
Sold by
Mountain Valley Development Inc
Bought by
Greyeye Enterprises Inc
Home Financials for this Owner
Home Financials are based on the most recent Mortgage that was taken out on this home.
Original Mortgage
$92,250
Interest Rate
7.13%
Mortgage Type
Construction
Create a Home Valuation Report for This Property
The Home Valuation Report is an in-depth analysis detailing your home's value as well as a comparison with similar homes in the area
Home Values in the Area
Average Home Value in this Area
Purchase History
| Date | Buyer | Sale Price | Title Company |
|---|---|---|---|
| Smith Mike George | -- | Advanced Title Co | |
| Greyeye Enterprises Inc | -- | Hickman Land Title Company |
Source: Public Records
Mortgage History
| Date | Status | Borrower | Loan Amount |
|---|---|---|---|
| Open | Smith Mike George | $111,900 | |
| Previous Owner | Greyeye Enterprises Inc | $92,250 |
Source: Public Records
Tax History
| Year | Tax Paid | Tax Assessment Tax Assessment Total Assessment is a certain percentage of the fair market value that is determined by local assessors to be the total taxable value of land and additions on the property. | Land | Improvement |
|---|---|---|---|---|
| 2025 | $1,507 | $216,430 | $0 | $0 |
| 2024 | $1,606 | $215,340 | $0 | $0 |
| 2023 | $1,663 | $213,260 | $0 | $0 |
| 2022 | $174 | $213,255 | $0 | $0 |
| 2021 | $1,707 | $323,195 | $65,000 | $258,195 |
| 2020 | $1,288 | $228,817 | $65,000 | $163,817 |
| 2019 | $1,220 | $203,817 | $40,000 | $163,817 |
| 2018 | $1,130 | $182,450 | $40,000 | $142,450 |
| 2017 | $1,112 | $93,225 | $0 | $0 |
| 2016 | $1,137 | $91,850 | $0 | $0 |
| 2015 | $916 | $74,875 | $0 | $0 |
| 2014 | $896 | $74,875 | $0 | $0 |
| 2013 | -- | $74,875 | $0 | $0 |
Source: Public Records
Map
Nearby Homes
Your Personal Tour Guide
Ask me questions while you tour the home.