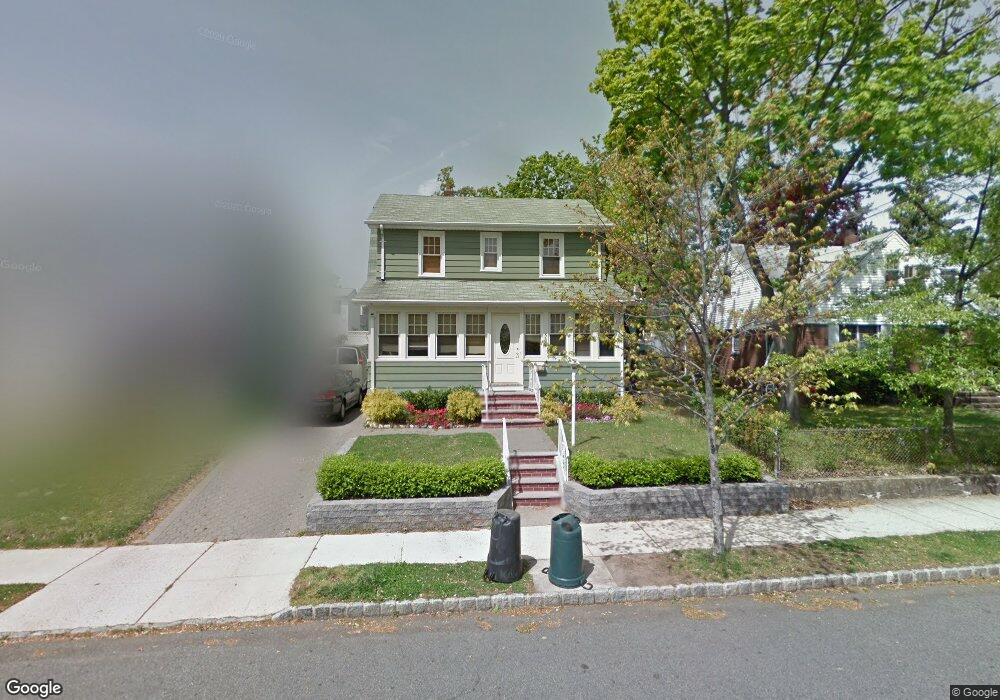
52 S Franklin Ave Bergenfield, NJ 07621
Estimated Value: $679,011 - $721,000
--
Bed
--
Bath
2,138
Sq Ft
$327/Sq Ft
Est. Value
About This Home
This home is located at 52 S Franklin Ave, Bergenfield, NJ 07621 and is currently estimated at $699,503, approximately $327 per square foot. 52 S Franklin Ave is a home located in Bergen County with nearby schools including Bergenfield High School and Solomon Schechter Day School.
Ownership History
Date
Name
Owned For
Owner Type
Purchase Details
Closed on
Apr 12, 2021
Sold by
Vasquez America P
Bought by
Vasquez Jose A and Vasquez Cesarina A
Current Estimated Value
Home Financials for this Owner
Home Financials are based on the most recent Mortgage that was taken out on this home.
Original Mortgage
$372,000
Interest Rate
2.8%
Mortgage Type
New Conventional
Purchase Details
Closed on
Dec 21, 2007
Sold by
Mandjian Serip and Mandjian Hasmig
Bought by
Vasquez Jose A and Vasquez Cesarina A
Home Financials for this Owner
Home Financials are based on the most recent Mortgage that was taken out on this home.
Original Mortgage
$399,000
Interest Rate
6.27%
Mortgage Type
New Conventional
Purchase Details
Closed on
May 23, 2003
Sold by
Kohli Thomas
Bought by
Mandjian Serop and Mandjian Hasmig
Home Financials for this Owner
Home Financials are based on the most recent Mortgage that was taken out on this home.
Original Mortgage
$260,000
Interest Rate
5.27%
Create a Home Valuation Report for This Property
The Home Valuation Report is an in-depth analysis detailing your home's value as well as a comparison with similar homes in the area
Home Values in the Area
Average Home Value in this Area
Purchase History
| Date | Buyer | Sale Price | Title Company |
|---|---|---|---|
| Vasquez Jose A | -- | Accommodation | |
| Vasquez Jose A | $420,000 | -- | |
| Mandjian Serop | $325,000 | -- |
Source: Public Records
Mortgage History
| Date | Status | Borrower | Loan Amount |
|---|---|---|---|
| Previous Owner | Vasquez Jose A | $372,000 | |
| Previous Owner | Vasquez Jose A | $399,000 | |
| Previous Owner | Mandjian Serop | $260,000 |
Source: Public Records
Tax History Compared to Growth
Tax History
| Year | Tax Paid | Tax Assessment Tax Assessment Total Assessment is a certain percentage of the fair market value that is determined by local assessors to be the total taxable value of land and additions on the property. | Land | Improvement |
|---|---|---|---|---|
| 2025 | $11,378 | $322,600 | $149,600 | $173,000 |
| 2024 | $11,001 | $322,600 | $149,600 | $173,000 |
| 2023 | $10,830 | $322,600 | $149,600 | $173,000 |
| 2022 | $10,830 | $322,600 | $149,600 | $173,000 |
| 2021 | $8,055 | $322,600 | $149,600 | $173,000 |
| 2020 | $10,646 | $322,600 | $149,600 | $173,000 |
| 2019 | $10,523 | $322,600 | $149,600 | $173,000 |
| 2018 | $10,446 | $322,600 | $149,600 | $173,000 |
| 2017 | $10,394 | $322,600 | $149,600 | $173,000 |
| 2016 | $10,230 | $322,600 | $149,600 | $173,000 |
| 2015 | $10,072 | $322,600 | $149,600 | $173,000 |
| 2014 | $9,888 | $322,600 | $149,600 | $173,000 |
Source: Public Records
Map
Nearby Homes
- 125 W Main St
- 86 W Main St
- 167 Vreeland Ave
- 53 Somers Ave
- 41 Woods Ave
- 86 Levitt Ave
- 25 Ralph St
- 18 Carlisle St
- 57 Luke Ave
- 16 Palisade Ave
- 131 N Prospect Ave
- 34 N Washington Ave
- 768 Birch Ave
- 17 S Paula Dr
- 136 W Central Ave
- 463 Luhmann Dr
- 64 Madison Ave
- 83 N Washington Ave
- 70 Greenwich St
- 207 Melrose Ave
- 58 S Franklin Ave
- 48 S Franklin Ave
- 62 S Franklin Ave
- 14 Turnure St
- 15 Sunset Place
- 18 Turnure St
- 19 Sunset Place
- 45 S Franklin Ave
- 41 S Franklin Ave
- 49 S Franklin Ave
- 34 S Franklin Ave
- 37 S Franklin Ave
- 74 S Franklin Ave
- 22 Turnure St
- 53 S Franklin Ave
- 53 S Franklin Ave Unit 1st Floor
- 53 S Franklin Ave Unit 2nd Fl
- 33 S Franklin Ave Unit 35
- 11 Turnure St
- 23 Sunset Place