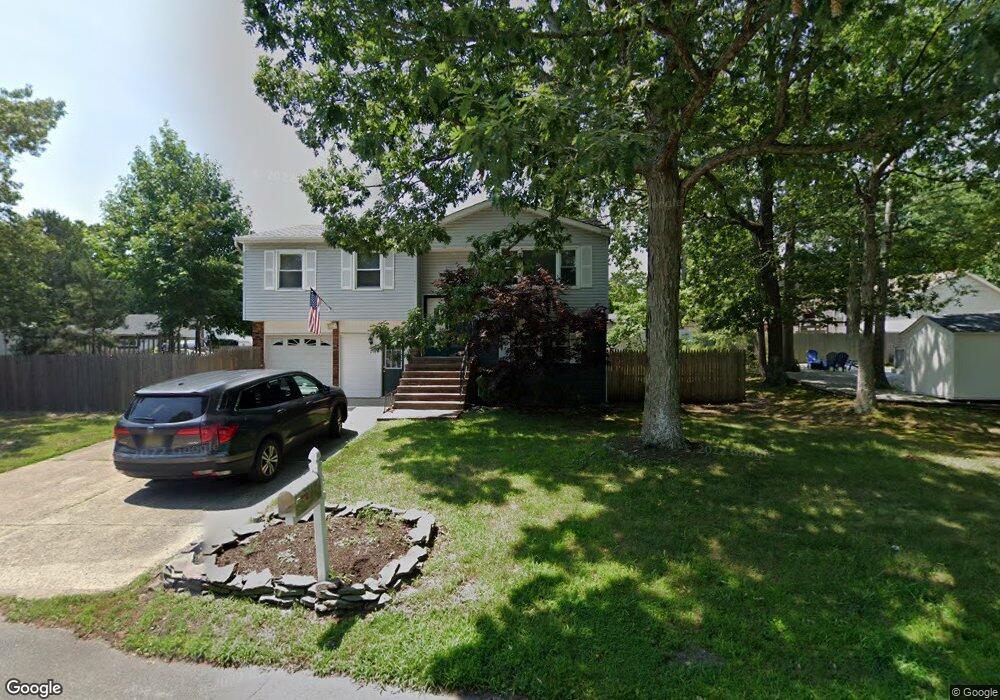
52 Saint Andrews Dr Little Egg Harbor Township, NJ 08087
Little Egg Harbor Township NeighborhoodEstimated Value: $245,000 - $465,000
5
Beds
2
Baths
2,348
Sq Ft
$165/Sq Ft
Est. Value
About This Home
This home is located at 52 Saint Andrews Dr, Little Egg Harbor Township, NJ 08087 and is currently estimated at $387,041, approximately $164 per square foot. 52 Saint Andrews Dr is a home located in Ocean County with nearby schools including Frog Pond Elementary School, Pinelands Regional Junior High School, and Pinelands Regional High School.
Ownership History
Date
Name
Owned For
Owner Type
Purchase Details
Closed on
Dec 29, 2020
Sold by
Mtglq Investors Lp
Bought by
Griffin Conn Dale and Conn James
Current Estimated Value
Purchase Details
Closed on
Jan 21, 2020
Sold by
Loch Deborah I and Duigan William F
Bought by
Mtglq Investors Lp
Purchase Details
Closed on
Nov 30, 2005
Sold by
Duignan William
Bought by
Loch Deborah L
Purchase Details
Closed on
Oct 24, 2000
Sold by
Wysocki Walter
Bought by
Smith Michael
Home Financials for this Owner
Home Financials are based on the most recent Mortgage that was taken out on this home.
Original Mortgage
$139,826
Interest Rate
7.83%
Mortgage Type
FHA
Purchase Details
Closed on
Mar 24, 1997
Sold by
Rizzuto Santo
Bought by
Smith Michael
Create a Home Valuation Report for This Property
The Home Valuation Report is an in-depth analysis detailing your home's value as well as a comparison with similar homes in the area
Home Values in the Area
Average Home Value in this Area
Purchase History
| Date | Buyer | Sale Price | Title Company |
|---|---|---|---|
| Griffin Conn Dale | $142,000 | Consumers Choice Title | |
| Conn James | $142,000 | None Listed On Document | |
| Mtglq Investors Lp | $101,000 | None Available | |
| Loch Deborah L | -- | -- | |
| Smith Michael | $138,000 | -- | |
| Smith Michael | $138,000 | -- | |
| Duignan William | $141,000 | -- | |
| Duignan William | $141,000 | -- | |
| Smith Michael | $95,000 | -- |
Source: Public Records
Mortgage History
| Date | Status | Borrower | Loan Amount |
|---|---|---|---|
| Previous Owner | Duignan William | $139,826 | |
| Previous Owner | Duignan William | $124,200 |
Source: Public Records
Tax History Compared to Growth
Tax History
| Year | Tax Paid | Tax Assessment Tax Assessment Total Assessment is a certain percentage of the fair market value that is determined by local assessors to be the total taxable value of land and additions on the property. | Land | Improvement |
|---|---|---|---|---|
| 2025 | $6,033 | $203,600 | $76,200 | $127,400 |
| 2024 | $5,780 | $203,600 | $76,200 | $127,400 |
| 2023 | $5,599 | $203,600 | $76,200 | $127,400 |
| 2022 | $5,599 | $203,600 | $76,200 | $127,400 |
| 2021 | $5,467 | $203,600 | $76,200 | $127,400 |
| 2020 | $5,515 | $208,100 | $76,200 | $131,900 |
| 2019 | $5,292 | $208,100 | $76,200 | $131,900 |
| 2018 | $4,990 | $208,100 | $76,200 | $131,900 |
| 2017 | $4,913 | $208,100 | $76,200 | $131,900 |
| 2016 | $4,953 | $208,100 | $76,200 | $131,900 |
| 2015 | $5,013 | $208,100 | $76,200 | $131,900 |
| 2014 | $4,978 | $260,500 | $92,400 | $168,100 |
Source: Public Records
Map
Nearby Homes
- 16 Tavistock Dr
- 7 Baltusrol Ct
- 31 Pin Oak Ln
- 4 Merion Ct
- 30 Whitemarsh Ct Unit 1710
- 30 Whitemarsh Ct Unit 171
- 168 Westchester Dr
- 314 Lake Crystalbrook Dr
- 21 Schooner Ct
- 1 Pinehurst Dr
- 27 Ketch Ct
- 117 Lexington Dr
- 13 Pinehurst Dr
- 105 Lexington Dr
- 12 Pinehurst Dr
- 45 Stonegate Dr
- 19 Atlantis Blvd
- 60 Windstar Dr
- 4 Bristol Terrace
- 47 Pinehurst Dr
- 51 Saint Andrews Dr
- 55 Saint Andrews Dr
- 48 Saint Andrews Dr
- 4 Hogan Ct
- 8 Hogan Ct
- 44 Saint Andrews Dr
- 44 St Andrews Dr
- 4 Runyon Ct
- 36 Saint Andrews Dr
- 12 Hogan Ct
- 59 Saint Andrews Dr
- 8 Runyon Ct
- 16 Hogan Ct
- 32 Saint Andrews Dr
- 28 Saint Andrews Dr
- 60 Saint Andrews Dr
- 3 Runyon Ct
- 7 Fazio Ct
- 3 Demaret Ct
- 63 Saint Andrews Dr