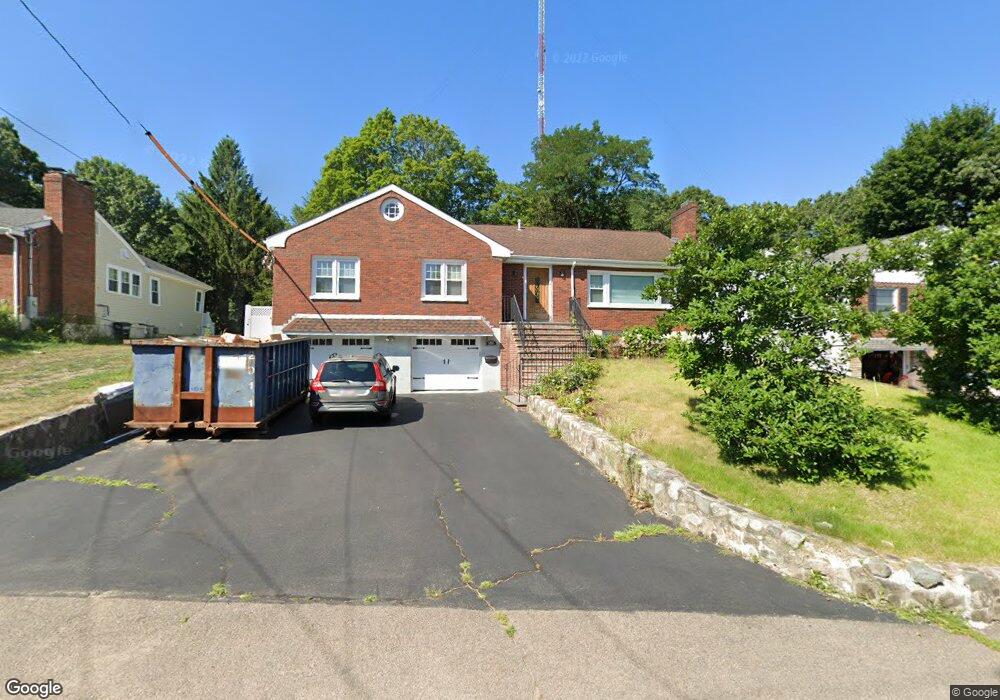
52 Saint Mary St Needham Heights, MA 02494
Estimated Value: $1,126,000 - $1,268,849
4
Beds
2
Baths
1,668
Sq Ft
$723/Sq Ft
Est. Value
About This Home
This home is located at 52 Saint Mary St, Needham Heights, MA 02494 and is currently estimated at $1,206,212, approximately $723 per square foot. 52 Saint Mary St is a home located in Norfolk County with nearby schools including Eliot Elementary School, High Rock Middle School, and Pollard Middle School.
Ownership History
Date
Name
Owned For
Owner Type
Purchase Details
Closed on
Jan 30, 2009
Sold by
Levy Eliahu
Bought by
Feinstein Boris L and Arzoumanian Helen
Current Estimated Value
Home Financials for this Owner
Home Financials are based on the most recent Mortgage that was taken out on this home.
Original Mortgage
$384,400
Outstanding Balance
$245,318
Interest Rate
5.28%
Mortgage Type
Purchase Money Mortgage
Estimated Equity
$960,894
Create a Home Valuation Report for This Property
The Home Valuation Report is an in-depth analysis detailing your home's value as well as a comparison with similar homes in the area
Home Values in the Area
Average Home Value in this Area
Purchase History
| Date | Buyer | Sale Price | Title Company |
|---|---|---|---|
| Feinstein Boris L | $480,500 | -- | |
| Feinstein Boris L | $480,500 | -- |
Source: Public Records
Mortgage History
| Date | Status | Borrower | Loan Amount |
|---|---|---|---|
| Open | Feinstein Boris L | $384,400 | |
| Closed | Feinstein Boris L | $384,400 |
Source: Public Records
Tax History Compared to Growth
Tax History
| Year | Tax Paid | Tax Assessment Tax Assessment Total Assessment is a certain percentage of the fair market value that is determined by local assessors to be the total taxable value of land and additions on the property. | Land | Improvement |
|---|---|---|---|---|
| 2025 | $11,586 | $1,093,000 | $719,400 | $373,600 |
| 2024 | $9,518 | $760,200 | $350,300 | $409,900 |
| 2023 | $9,500 | $728,500 | $350,300 | $378,200 |
| 2022 | $8,015 | $599,500 | $322,300 | $277,200 |
| 2021 | $7,811 | $599,500 | $322,300 | $277,200 |
| 2020 | $7,525 | $602,500 | $322,300 | $280,200 |
| 2019 | $7,076 | $571,100 | $294,000 | $277,100 |
| 2018 | $6,785 | $571,100 | $294,000 | $277,100 |
| 2017 | $6,343 | $533,500 | $294,000 | $239,500 |
| 2016 | $6,157 | $533,500 | $294,000 | $239,500 |
| 2015 | $6,023 | $533,500 | $294,000 | $239,500 |
| 2014 | $5,587 | $480,000 | $246,800 | $233,200 |
Source: Public Records
Map
Nearby Homes
- 181 Saint Mary St
- 84-86 Pennsylvania Ave Unit 2
- 989 Chestnut St Unit 8
- 992 Chestnut St
- 21 Hale St Unit 21
- 968 Chestnut St
- 10 Fife Rd
- 1175 Chestnut St Unit 27
- 206 Cedar St
- 345 Central Ave
- 6 Willow St
- 304 Elliot St Carriage House S Unit 4
- 302 Elliot St Carriage House N Unit 3
- 300 Elliot St Unit 2
- 51 Pettee St Unit 13
- 51 Pettee St Unit 11
- 20 Pennsylvania Ave
- 20 Pennsylvania Ave Unit 20
- 18 Pennsylvania Ave Unit 20
- 66 Rockland Place
- 58 Saint Mary St
- 53 Saint Mary St
- 47 Saint Mary St
- 46 St Mary Unit 1
- 46 Saint Mary St
- 46 Saint Mary St Unit 46
- 12 Evergreen Rd
- 63 St Mary St
- 63 Saint Mary St
- 66 Saint Mary St
- 6 Evergreen Rd
- 40 Saint Mary St
- 18 Evergreen Rd
- 34 Saint Mary St
- 16 Daley St
- 35 Saint Mary St
- 73 Saint Mary St
- 32 Daley St
- 11 Daley St
- 11 Daley St Unit 11