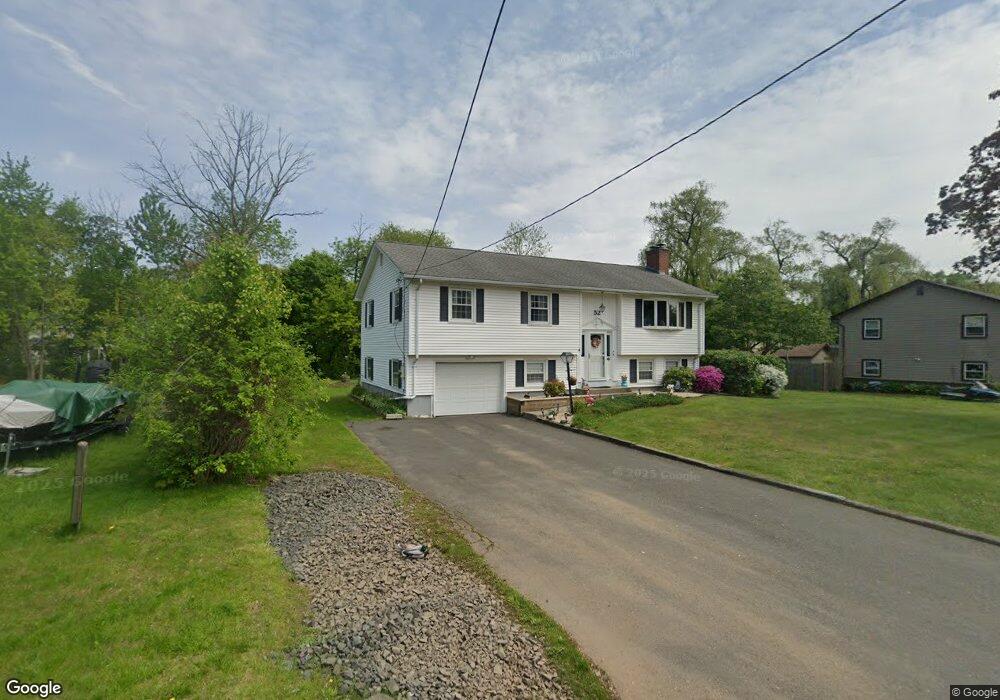
52 Salem St West Springfield, MA 01089
Estimated Value: $354,000 - $366,000
3
Beds
2
Baths
1,252
Sq Ft
$287/Sq Ft
Est. Value
About This Home
This home is located at 52 Salem St, West Springfield, MA 01089 and is currently estimated at $359,206, approximately $286 per square foot. 52 Salem St is a home located in Hampden County with nearby schools including West Springfield High School and St Thomas The Apostle School.
Ownership History
Date
Name
Owned For
Owner Type
Purchase Details
Closed on
Apr 6, 2016
Sold by
Joslin Virginia B
Bought by
Bassi Virginia L and Bird Mark A
Current Estimated Value
Create a Home Valuation Report for This Property
The Home Valuation Report is an in-depth analysis detailing your home's value as well as a comparison with similar homes in the area
Home Values in the Area
Average Home Value in this Area
Purchase History
| Date | Buyer | Sale Price | Title Company |
|---|---|---|---|
| Bassi Virginia L | -- | -- |
Source: Public Records
Tax History
| Year | Tax Paid | Tax Assessment Tax Assessment Total Assessment is a certain percentage of the fair market value that is determined by local assessors to be the total taxable value of land and additions on the property. | Land | Improvement |
|---|---|---|---|---|
| 2025 | $4,772 | $320,900 | $130,900 | $190,000 |
| 2024 | $4,770 | $322,100 | $130,900 | $191,200 |
| 2023 | $4,402 | $283,300 | $130,900 | $152,400 |
| 2022 | $4,050 | $257,000 | $118,700 | $138,300 |
| 2021 | $4,085 | $241,700 | $112,100 | $129,600 |
| 2020 | $4,011 | $236,100 | $112,100 | $124,000 |
| 2019 | $4,004 | $236,100 | $112,100 | $124,000 |
| 2018 | $4,026 | $236,100 | $112,100 | $124,000 |
| 2017 | $4,026 | $236,100 | $112,100 | $124,000 |
| 2016 | $3,901 | $229,600 | $107,700 | $121,900 |
| 2015 | $3,826 | $225,200 | $105,600 | $119,600 |
| 2014 | $929 | $225,200 | $105,600 | $119,600 |
Source: Public Records
Map
Nearby Homes
- 88 Verdugo St
- 65 Verdugo St
- 62 Talcott Ave
- 240 Morton St
- 61 Clarence St
- 65 Churchill Rd
- 1996 Westfield St
- 32 Glenview Dr
- 750 Amostown Rd
- 0 Ahiska Rd Unit 73477754
- 81 Chestnut St
- 144 Almon Ave
- 32 Maple St
- 117 Sibley Ave
- 128 Hampden St
- 31 North Blvd
- 791 Morgan Rd
- 34 High Meadow Dr
- 115 Grove St
- 24 Hampden St
Your Personal Tour Guide
Ask me questions while you tour the home.