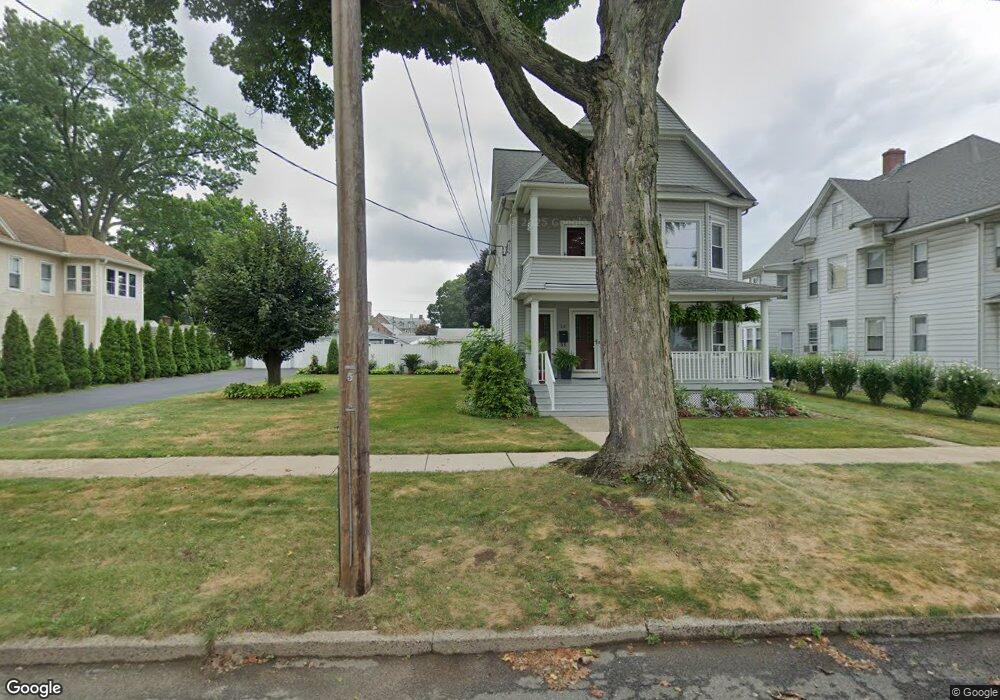
52 Saratoga Ave Unit 1 Chicopee, MA 01013
Chicopee Center NeighborhoodEstimated Value: $350,000 - $446,000
2
Beds
1
Bath
1,200
Sq Ft
$334/Sq Ft
Est. Value
About This Home
This home is located at 52 Saratoga Ave Unit 1, Chicopee, MA 01013 and is currently estimated at $400,985, approximately $334 per square foot. 52 Saratoga Ave Unit 1 is a home located in Hampden County with nearby schools including Bowe Elementary School, Fairview Middle School, and Chicopee High School.
Ownership History
Date
Name
Owned For
Owner Type
Purchase Details
Closed on
Nov 25, 2009
Sold by
Kowal Joseph and Kowal Jean T
Bought by
Szmyd Marek and Szmyd Elzbieta
Current Estimated Value
Home Financials for this Owner
Home Financials are based on the most recent Mortgage that was taken out on this home.
Original Mortgage
$223,000
Outstanding Balance
$145,603
Interest Rate
4.92%
Mortgage Type
Purchase Money Mortgage
Estimated Equity
$255,382
Purchase Details
Closed on
Dec 1, 2008
Sold by
Baran John A and Baran Susan M
Bought by
Kowal Jean T and Kowal Joseph
Create a Home Valuation Report for This Property
The Home Valuation Report is an in-depth analysis detailing your home's value as well as a comparison with similar homes in the area
Home Values in the Area
Average Home Value in this Area
Purchase History
| Date | Buyer | Sale Price | Title Company |
|---|---|---|---|
| Szmyd Marek | $223,000 | -- | |
| Kowal Jean T | $223,000 | -- |
Source: Public Records
Mortgage History
| Date | Status | Borrower | Loan Amount |
|---|---|---|---|
| Open | Szmyd Marek | $223,000 |
Source: Public Records
Tax History Compared to Growth
Tax History
| Year | Tax Paid | Tax Assessment Tax Assessment Total Assessment is a certain percentage of the fair market value that is determined by local assessors to be the total taxable value of land and additions on the property. | Land | Improvement |
|---|---|---|---|---|
| 2025 | $5,012 | $330,600 | $100,900 | $229,700 |
| 2024 | $4,744 | $321,400 | $98,900 | $222,500 |
| 2023 | $4,431 | $292,500 | $89,900 | $202,600 |
| 2022 | $4,343 | $255,600 | $78,200 | $177,400 |
| 2021 | $4,123 | $234,100 | $71,100 | $163,000 |
| 2020 | $3,890 | $222,800 | $71,100 | $151,700 |
| 2019 | $3,808 | $212,000 | $71,100 | $140,900 |
| 2018 | $3,721 | $203,200 | $67,700 | $135,500 |
| 2017 | $3,330 | $192,400 | $67,700 | $124,700 |
| 2016 | $3,054 | $180,600 | $67,700 | $112,900 |
| 2015 | $3,241 | $184,800 | $67,700 | $117,100 |
| 2014 | $1,621 | $184,800 | $67,700 | $117,100 |
Source: Public Records
Map
Nearby Homes