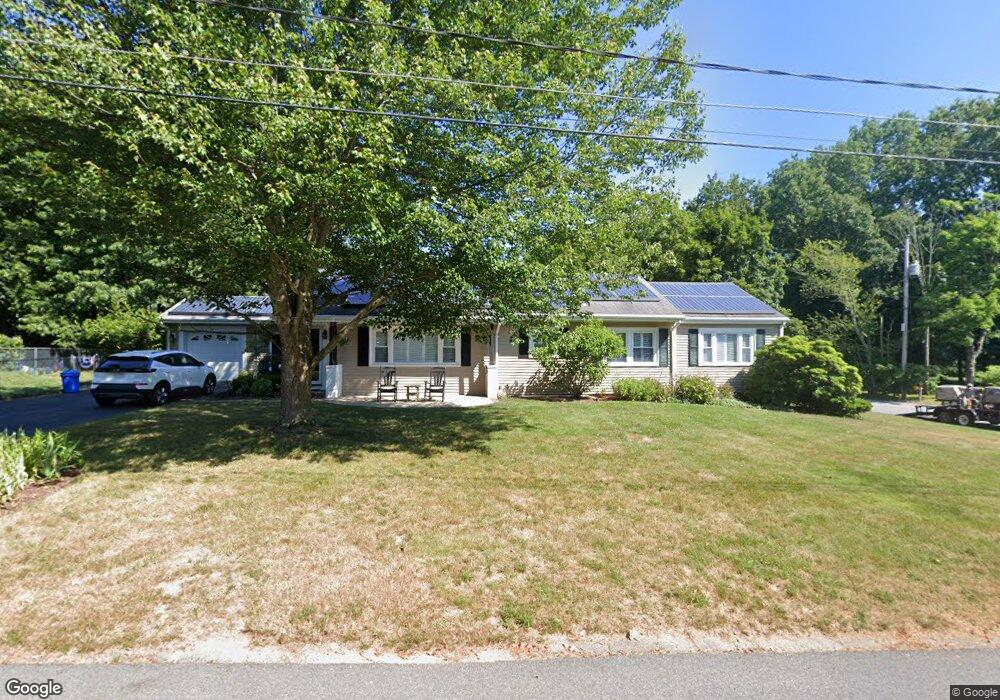
52 Shawnee Ave East Bridgewater, MA 02333
Estimated Value: $560,584 - $622,000
3
Beds
3
Baths
1,506
Sq Ft
$394/Sq Ft
Est. Value
About This Home
This home is located at 52 Shawnee Ave, East Bridgewater, MA 02333 and is currently estimated at $592,646, approximately $393 per square foot. 52 Shawnee Ave is a home located in Plymouth County with nearby schools including Gordon W Mitchell Middle School, East Bridgewater Jr./Sr. High School, and New Heights Charter School.
Ownership History
Date
Name
Owned For
Owner Type
Purchase Details
Closed on
Aug 24, 1994
Sold by
Hamm Robert E and Hamm Donna M
Bought by
Tommervik David R and Marek Anne E
Current Estimated Value
Home Financials for this Owner
Home Financials are based on the most recent Mortgage that was taken out on this home.
Original Mortgage
$104,900
Interest Rate
8.65%
Mortgage Type
Purchase Money Mortgage
Create a Home Valuation Report for This Property
The Home Valuation Report is an in-depth analysis detailing your home's value as well as a comparison with similar homes in the area
Home Values in the Area
Average Home Value in this Area
Purchase History
| Date | Buyer | Sale Price | Title Company |
|---|---|---|---|
| Tommervik David R | $139,900 | -- |
Source: Public Records
Mortgage History
| Date | Status | Borrower | Loan Amount |
|---|---|---|---|
| Open | Tommervik David R | $94,000 | |
| Closed | Tommervik David R | $100,550 | |
| Closed | Tommervik David R | $104,900 |
Source: Public Records
Tax History Compared to Growth
Tax History
| Year | Tax Paid | Tax Assessment Tax Assessment Total Assessment is a certain percentage of the fair market value that is determined by local assessors to be the total taxable value of land and additions on the property. | Land | Improvement |
|---|---|---|---|---|
| 2025 | $5,761 | $421,400 | $172,100 | $249,300 |
| 2024 | $5,670 | $409,700 | $165,500 | $244,200 |
| 2023 | $5,625 | $389,300 | $165,500 | $223,800 |
| 2022 | $5,618 | $360,100 | $150,500 | $209,600 |
| 2021 | $89 | $326,000 | $144,600 | $181,400 |
| 2020 | $117 | $319,400 | $139,100 | $180,300 |
| 2019 | $5,449 | $310,300 | $132,900 | $177,400 |
| 2018 | $5,253 | $292,500 | $132,900 | $159,600 |
| 2017 | $168 | $281,300 | $126,800 | $154,500 |
| 2016 | $5,047 | $277,900 | $126,800 | $151,100 |
| 2015 | $4,905 | $276,200 | $125,900 | $150,300 |
| 2014 | $4,712 | $271,300 | $123,200 | $148,100 |
Source: Public Records
Map
Nearby Homes