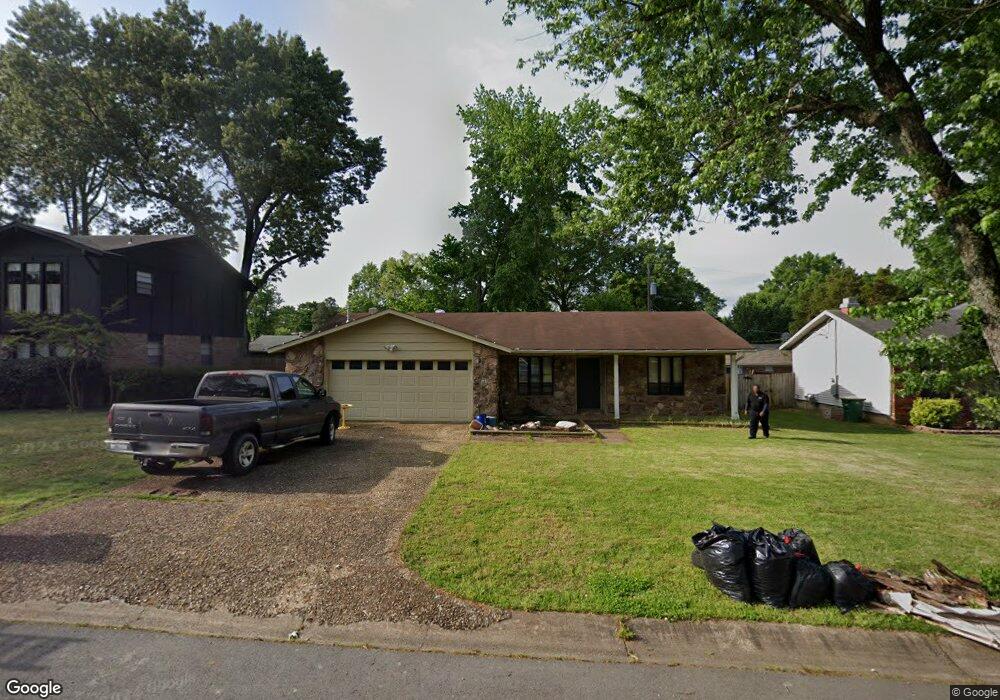
52 Spring Grove Dr Sherwood, AR 72120
Estimated Value: $192,000 - $201,000
3
Beds
2
Baths
1,544
Sq Ft
$127/Sq Ft
Est. Value
About This Home
This home is located at 52 Spring Grove Dr, Sherwood, AR 72120 and is currently estimated at $196,380, approximately $127 per square foot. 52 Spring Grove Dr is a home located in Pulaski County with nearby schools including Oakbrooke Elementary School, Sylvan Hills Middle School, and Sylvan Hills High School.
Ownership History
Date
Name
Owned For
Owner Type
Purchase Details
Closed on
May 20, 2011
Sold by
Geran Jill M and Geran Kurt R
Bought by
Ramsey David and Ramsey Chelsea
Current Estimated Value
Home Financials for this Owner
Home Financials are based on the most recent Mortgage that was taken out on this home.
Original Mortgage
$121,831
Outstanding Balance
$84,939
Interest Rate
4.95%
Mortgage Type
FHA
Estimated Equity
$111,441
Purchase Details
Closed on
May 5, 2005
Sold by
Perdue Gary W
Bought by
Taylor Jill M and Geran Kurt R
Home Financials for this Owner
Home Financials are based on the most recent Mortgage that was taken out on this home.
Original Mortgage
$102,636
Interest Rate
5.92%
Mortgage Type
FHA
Purchase Details
Closed on
May 21, 2003
Sold by
Perdue Bertha R
Bought by
Perdue Gary W and Holloway Carol
Create a Home Valuation Report for This Property
The Home Valuation Report is an in-depth analysis detailing your home's value as well as a comparison with similar homes in the area
Home Values in the Area
Average Home Value in this Area
Purchase History
| Date | Buyer | Sale Price | Title Company |
|---|---|---|---|
| Ramsey David | $125,000 | Multiple | |
| Taylor Jill M | $104,000 | American Abstract & Title Co | |
| Taylor Jill M | -- | American Abstract & Title Co | |
| Taylor Jill M | $104,000 | American Abstract & Title Co | |
| Perdue Gary W | $81,000 | The Title Co |
Source: Public Records
Mortgage History
| Date | Status | Borrower | Loan Amount |
|---|---|---|---|
| Open | Ramsey David | $121,831 | |
| Previous Owner | Taylor Jill M | $102,636 |
Source: Public Records
Tax History Compared to Growth
Tax History
| Year | Tax Paid | Tax Assessment Tax Assessment Total Assessment is a certain percentage of the fair market value that is determined by local assessors to be the total taxable value of land and additions on the property. | Land | Improvement |
|---|---|---|---|---|
| 2025 | $1,361 | $28,669 | $5,200 | $23,469 |
| 2024 | $1,248 | $28,669 | $5,200 | $23,469 |
| 2023 | $1,248 | $28,669 | $5,200 | $23,469 |
| 2022 | $1,342 | $28,669 | $5,200 | $23,469 |
| 2021 | $1,248 | $21,770 | $4,100 | $17,670 |
| 2020 | $867 | $21,770 | $4,100 | $17,670 |
| 2019 | $867 | $21,770 | $4,100 | $17,670 |
| 2018 | $892 | $21,770 | $4,100 | $17,670 |
| 2017 | $883 | $21,770 | $4,100 | $17,670 |
| 2016 | $849 | $21,110 | $3,960 | $17,150 |
| 2015 | $1,072 | $21,110 | $3,960 | $17,150 |
| 2014 | $1,072 | $21,110 | $3,960 | $17,150 |
Source: Public Records
Map
Nearby Homes
- 616 E Woodruff Ave
- 14 Pamela Ln
- 9318 Woodbine Sttreet
- 109 Pamela Ln
- 111 Pamela Ln
- 59 Wesley Dr
- 9125 Woodbine St
- 519 Hillcrest Rd
- 1300 E Maryland Ave
- 9460 Robin Ln
- 2949 Maelstrom Cir
- 1109 Brice Rd
- 2520 Austin Oaks Dr
- 222 Gragson Ave
- 3032 Overcup Dr
- 9016 Wilhite Ln
- 105 Wild Oak Dr
- 8921 Claremont Ave
- Lot 4 Johnson Dr
- 00 Johnson Dr
- 56 Spring Grove Dr
- 48 Spring Grove Dr
- 605 Colynwood Dr
- 601 Colynwood Dr
- 609 Colynwood Dr
- 44 Spring Grove Dr
- 60 Spring Grove Dr
- 53 Spring Grove Dr
- 49 Spring Grove Dr
- 521 Colynwood Dr
- 613 Colynwood Dr
- 57 Spring Grove Dr
- 45 Spring Grove Dr
- 40 Spring Grove Dr
- 72 Spring Grove Dr
- 61 Spring Grove Dr
- 517 Colynwood Dr
- 0 Colynwood Dr
- 617 Colynwood Dr
- 2984 Saratoga Ct