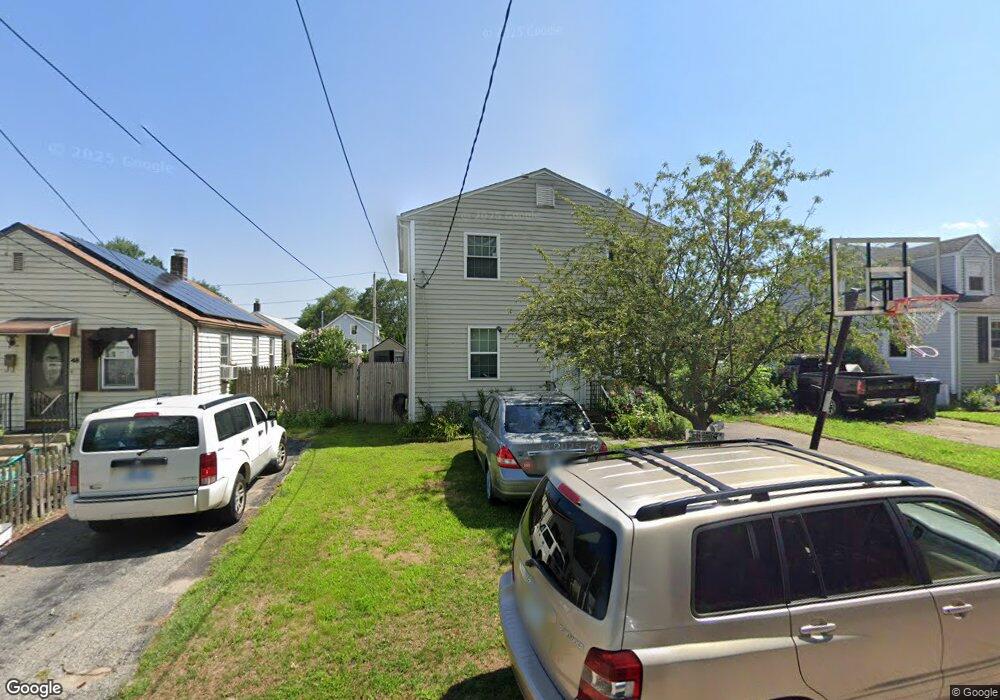
52 Stanmore Rd Warwick, RI 02889
Hoxie NeighborhoodEstimated Value: $350,000 - $435,000
2
Beds
1
Bath
1,065
Sq Ft
$367/Sq Ft
Est. Value
About This Home
This home is located at 52 Stanmore Rd, Warwick, RI 02889 and is currently estimated at $390,836, approximately $366 per square foot. 52 Stanmore Rd is a home located in Kent County with nearby schools including Saint Kevin School and Bishop Hendricken High School.
Ownership History
Date
Name
Owned For
Owner Type
Purchase Details
Closed on
Sep 2, 2005
Sold by
Houghton Amber M
Bought by
Campbell Mark D and Maslen Johanna D
Current Estimated Value
Home Financials for this Owner
Home Financials are based on the most recent Mortgage that was taken out on this home.
Original Mortgage
$199,335
Outstanding Balance
$105,062
Interest Rate
5.81%
Mortgage Type
Purchase Money Mortgage
Estimated Equity
$285,774
Purchase Details
Closed on
Dec 22, 1995
Sold by
Plante Gale P
Bought by
Houghton Amber M
Create a Home Valuation Report for This Property
The Home Valuation Report is an in-depth analysis detailing your home's value as well as a comparison with similar homes in the area
Home Values in the Area
Average Home Value in this Area
Purchase History
| Date | Buyer | Sale Price | Title Company |
|---|---|---|---|
| Campbell Mark D | $205,500 | -- | |
| Houghton Amber M | $82,000 | -- |
Source: Public Records
Mortgage History
| Date | Status | Borrower | Loan Amount |
|---|---|---|---|
| Open | Houghton Amber M | $25,000 | |
| Open | Houghton Amber M | $199,335 | |
| Previous Owner | Houghton Amber M | $27,000 | |
| Previous Owner | Houghton Amber M | $102,700 |
Source: Public Records
Tax History
| Year | Tax Paid | Tax Assessment Tax Assessment Total Assessment is a certain percentage of the fair market value that is determined by local assessors to be the total taxable value of land and additions on the property. | Land | Improvement |
|---|---|---|---|---|
| 2025 | $4,317 | $339,900 | $97,400 | $242,500 |
| 2024 | $4,085 | $282,300 | $78,600 | $203,700 |
| 2023 | $4,006 | $282,300 | $78,600 | $203,700 |
| 2022 | $4,036 | $215,500 | $55,900 | $159,600 |
| 2021 | $4,036 | $215,500 | $55,900 | $159,600 |
| 2020 | $4,036 | $215,500 | $55,900 | $159,600 |
| 2019 | $4,036 | $215,500 | $55,900 | $159,600 |
| 2018 | $3,355 | $161,300 | $52,000 | $109,300 |
| 2017 | $3,265 | $161,300 | $52,000 | $109,300 |
| 2016 | $3,265 | $161,300 | $52,000 | $109,300 |
| 2015 | $3,297 | $158,900 | $46,400 | $112,500 |
| 2014 | $3,188 | $158,900 | $46,400 | $112,500 |
| 2013 | $1,989 | $100,500 | $46,400 | $54,100 |
Source: Public Records
Map
Nearby Homes
Your Personal Tour Guide
Ask me questions while you tour the home.