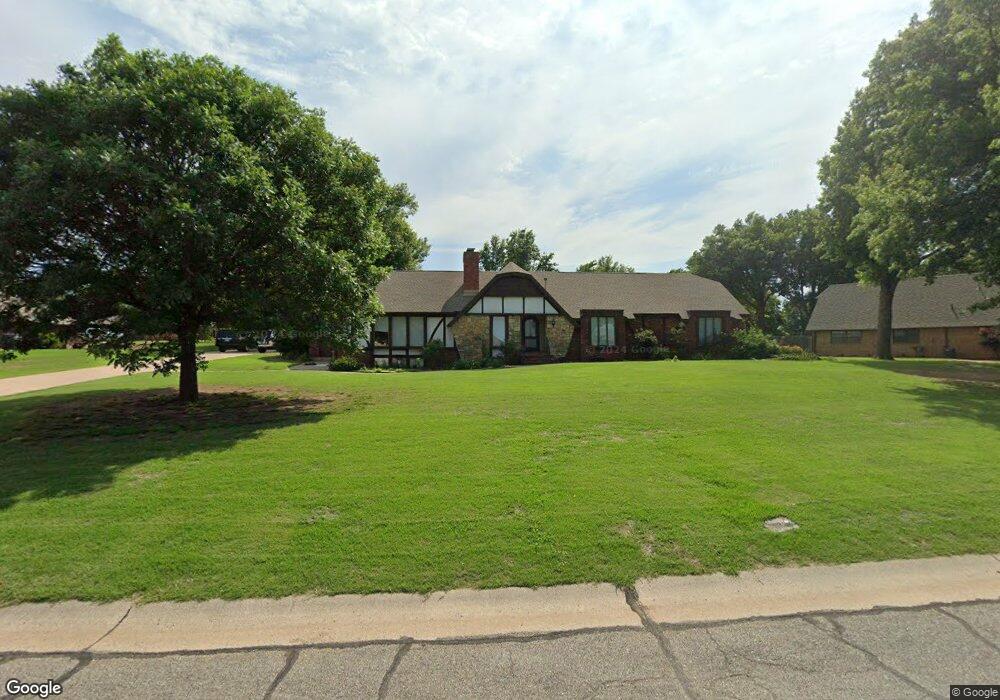
52 Stoneridge Rd Ponca City, OK 74604
Estimated Value: $299,971 - $344,000
4
Beds
3
Baths
2,381
Sq Ft
$136/Sq Ft
Est. Value
About This Home
This home is located at 52 Stoneridge Rd, Ponca City, OK 74604 and is currently estimated at $324,743, approximately $136 per square foot. 52 Stoneridge Rd is a home located in Kay County with nearby schools including Woodlands Elementary School, Ponca City East Middle School, and Ponca City West Middle School.
Ownership History
Date
Name
Owned For
Owner Type
Purchase Details
Closed on
Jun 10, 2020
Sold by
Chism Christine Lynn
Bought by
Bodenstein Chad R and Bodenstein Michele
Current Estimated Value
Home Financials for this Owner
Home Financials are based on the most recent Mortgage that was taken out on this home.
Original Mortgage
$208,550
Outstanding Balance
$184,864
Interest Rate
3.2%
Mortgage Type
New Conventional
Estimated Equity
$139,879
Purchase Details
Closed on
May 31, 2018
Sold by
Chism Garce A and Chism Brice B
Bought by
Chism Christine Lynn
Purchase Details
Closed on
May 18, 2017
Sold by
Chism Christine Lynn
Bought by
Chism Grace A and Chism Brice B
Purchase Details
Closed on
May 15, 2017
Sold by
Chism Grace A and Chism Brice B
Bought by
Chism Christine Lynn
Purchase Details
Closed on
Nov 2, 2011
Sold by
Chism Grace A and Chism Brice B
Bought by
Chism Grace A and Chism Brice B
Create a Home Valuation Report for This Property
The Home Valuation Report is an in-depth analysis detailing your home's value as well as a comparison with similar homes in the area
Home Values in the Area
Average Home Value in this Area
Purchase History
| Date | Buyer | Sale Price | Title Company |
|---|---|---|---|
| Bodenstein Chad R | $215,000 | First American Title Ins Co | |
| Chism Christine Lynn | -- | None Available | |
| Chism Grace A | -- | None Available | |
| Chism Christine Lynn | -- | None Available | |
| Chism Grace A | -- | -- |
Source: Public Records
Mortgage History
| Date | Status | Borrower | Loan Amount |
|---|---|---|---|
| Open | Bodenstein Chad R | $208,550 |
Source: Public Records
Tax History Compared to Growth
Tax History
| Year | Tax Paid | Tax Assessment Tax Assessment Total Assessment is a certain percentage of the fair market value that is determined by local assessors to be the total taxable value of land and additions on the property. | Land | Improvement |
|---|---|---|---|---|
| 2024 | $2,469 | $26,074 | $3,815 | $22,259 |
| 2023 | $2,469 | $24,833 | $3,815 | $21,018 |
| 2022 | $2,251 | $23,650 | $3,815 | $19,835 |
| 2021 | $2,262 | $23,650 | $3,815 | $19,835 |
| 2020 | $1,860 | $19,651 | $3,815 | $15,836 |
| 2019 | $1,816 | $19,003 | $3,815 | $15,188 |
| 2018 | $1,765 | $19,232 | $3,815 | $15,417 |
| 2017 | $1,783 | $19,195 | $3,815 | $15,380 |
| 2016 | $1,770 | $18,874 | $3,815 | $15,059 |
| 2015 | $1,723 | $18,324 | $3,815 | $14,509 |
| 2014 | -- | $17,790 | $3,815 | $13,975 |
Source: Public Records
Map
Nearby Homes
- 107 Stoneridge Dr
- 95 Stoneridge Dr
- 89 Stoneridge Dr
- 81 Stoneridge Rd
- 1705 Hathaway St
- 1409 Reveille Dr
- 2709 Canterbury Ave
- 2607 Bluestem Rd
- 1008 Kygar Rd
- 7525 E Prospect Ave
- 211 E Prospect Ave
- 1150 E Prospect Ave
- 2602 Fox Crossing
- 2601 & 2605 Fox Crossing
- 1610 Meadowbrook Dr
- 1916 Meadowbrook St
- 2205 Cardinal Rd
- 2825 L A Cann Dr
- 2216 El Camino St
- 2208 El Camino St
- 54 Stoneridge Rd
- 28 Stoneridge Rd
- 53 Stoneridge Rd
- 26 Stoneridge Rd
- 51 Stoneridge Rd
- 55 Stoneridge Rd
- 70 Stoneridge Rd
- 20 Stoneridge Rd
- 29 Stoneridge Rd
- 72 Stoneridge Rd
- 23 Stoneridge Dr
- 23 Stonridge Dr
- 27 Stoneridge Rd
- 49 Stoneridge Rd
- 59 Stoneridge Rd
- 71 Stoneridge Rd
- 10 Stoneridge Rd
- 21 Stoneridge Rd
- 31 Stoneridge Rd
- 47 Stoneridge Rd