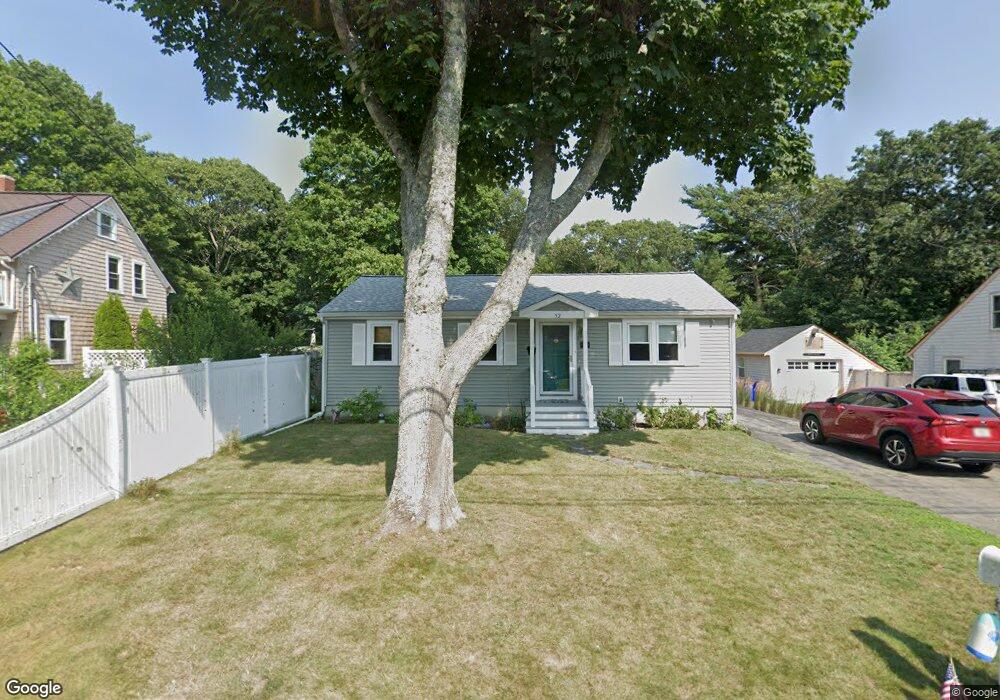
52 Thorne Rd Bourne, MA 2532
Estimated Value: $502,000 - $620,000
3
Beds
1
Bath
1,104
Sq Ft
$493/Sq Ft
Est. Value
About This Home
This home is located at 52 Thorne Rd, Bourne, MA 2532 and is currently estimated at $543,728, approximately $492 per square foot. 52 Thorne Rd is a home located in Barnstable County with nearby schools including Bourne High School, St Margaret Regional School, and Cadence Academy Preschool - Bourne.
Ownership History
Date
Name
Owned For
Owner Type
Purchase Details
Closed on
Jun 27, 2019
Sold by
Herron Grace and Herron Debra J
Bought by
Baker Merri I
Current Estimated Value
Purchase Details
Closed on
Nov 15, 1996
Sold by
Mancinelli Vincent J and Mancinelli Margo J
Bought by
Herron Michael P and Herron Debra J
Home Financials for this Owner
Home Financials are based on the most recent Mortgage that was taken out on this home.
Original Mortgage
$92,720
Interest Rate
7.99%
Mortgage Type
Purchase Money Mortgage
Create a Home Valuation Report for This Property
The Home Valuation Report is an in-depth analysis detailing your home's value as well as a comparison with similar homes in the area
Purchase History
| Date | Buyer | Sale Price | Title Company |
|---|---|---|---|
| Baker Merri I | $315,000 | -- | |
| Baker Merri I | $315,000 | -- | |
| Herron Michael P | $115,900 | -- | |
| Herron Michael P | $115,900 | -- |
Source: Public Records
Mortgage History
| Date | Status | Borrower | Loan Amount |
|---|---|---|---|
| Previous Owner | Herron Michael P | $112,000 | |
| Previous Owner | Herron Michael P | $100,000 | |
| Previous Owner | Herron Michael P | $92,720 |
Source: Public Records
Tax History
| Year | Tax Paid | Tax Assessment Tax Assessment Total Assessment is a certain percentage of the fair market value that is determined by local assessors to be the total taxable value of land and additions on the property. | Land | Improvement |
|---|---|---|---|---|
| 2025 | $3,681 | $471,300 | $233,800 | $237,500 |
| 2024 | $3,622 | $451,600 | $222,700 | $228,900 |
| 2023 | $3,521 | $399,700 | $197,100 | $202,600 |
| 2022 | $3,382 | $335,200 | $174,400 | $160,800 |
| 2021 | $3,235 | $300,400 | $158,700 | $141,700 |
| 2020 | $3,137 | $292,100 | $157,200 | $134,900 |
| 2019 | $3,174 | $302,000 | $174,700 | $127,300 |
| 2018 | $2,966 | $281,400 | $166,400 | $115,000 |
| 2017 | $2,755 | $267,500 | $164,800 | $102,700 |
| 2016 | $2,530 | $249,000 | $148,300 | $100,700 |
| 2015 | $2,286 | $227,000 | $126,300 | $100,700 |
Source: Public Records
Map
Nearby Homes
- 60 Bourne Neck Dr
- 35 Benedict Rd
- 5 Zoli Ln
- 46 Holt Rd Unit B
- 46 Holt Rd
- 203 County Rd
- 13 Laurel Hill Ct
- 40-A Lafayette Ave
- 44 Cotuit Rd
- 4 Van Bummel Rd
- 2 Applewood Ct
- 5 Sea Knoll Ct
- 56 Rip Van Winkle Way
- 60 Sandwich Rd
- 12 Turnberry Rd Unit 12
- 38 Old Bridge Rd
- 3 Honora Ln Unit 3
- 6 Honora Ct
- 4 Hollyhock Knoll Ct Unit 4
- 4 Hollyhock Knoll Ct Unit 4
Your Personal Tour Guide
Ask me questions while you tour the home.