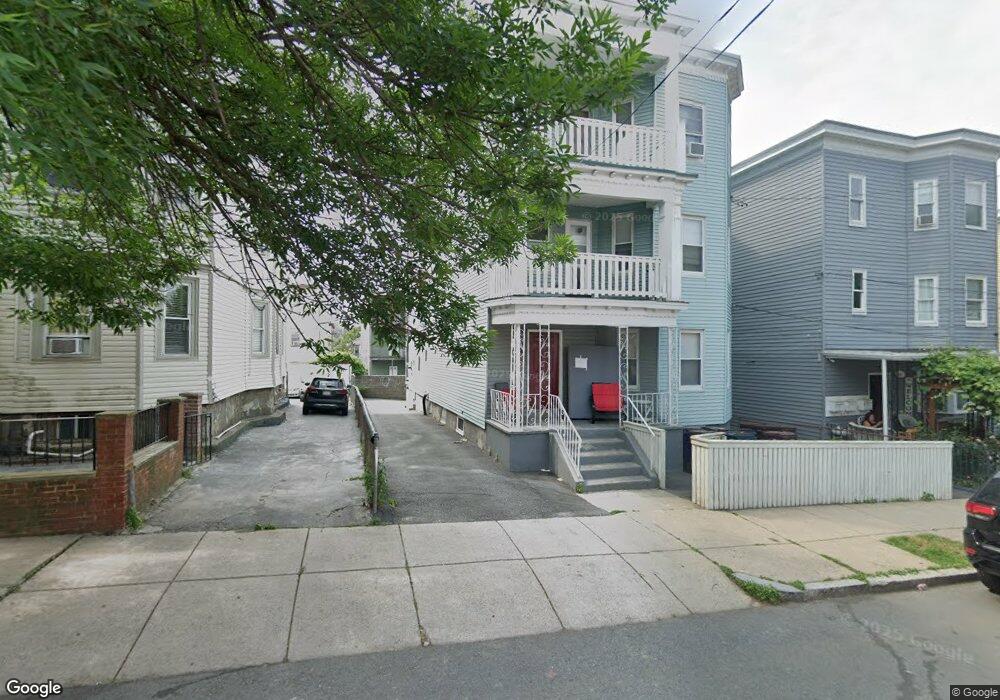
52 Thornton St Revere, MA 02151
Crescent Beach NeighborhoodEstimated Value: $766,780 - $1,050,000
6
Beds
3
Baths
3,759
Sq Ft
$231/Sq Ft
Est. Value
About This Home
This home is located at 52 Thornton St, Revere, MA 02151 and is currently estimated at $867,945, approximately $230 per square foot. 52 Thornton St is a home located in Suffolk County with nearby schools including Garfield Elementary School, Garfield Middle School, and Rumney Marsh Academy.
Ownership History
Date
Name
Owned For
Owner Type
Purchase Details
Closed on
Jan 28, 2021
Sold by
Dicostanzo Mario
Bought by
103 Everett Street Rt and Dicostanzo
Current Estimated Value
Purchase Details
Closed on
Aug 21, 1991
Sold by
Key Financial Services
Bought by
Dicostanzo Mario
Purchase Details
Closed on
Dec 7, 1990
Sold by
Atkinson Ian
Bought by
Key Fin Servs Inc
Purchase Details
Closed on
May 11, 1989
Sold by
Chrysler 1St Fin
Bought by
Atkinson Ian
Home Financials for this Owner
Home Financials are based on the most recent Mortgage that was taken out on this home.
Original Mortgage
$178,000
Interest Rate
11.14%
Mortgage Type
Purchase Money Mortgage
Purchase Details
Closed on
Jun 14, 1988
Sold by
Bellofatto Paul A
Bought by
Chrysler First Fin
Create a Home Valuation Report for This Property
The Home Valuation Report is an in-depth analysis detailing your home's value as well as a comparison with similar homes in the area
Home Values in the Area
Average Home Value in this Area
Purchase History
| Date | Buyer | Sale Price | Title Company |
|---|---|---|---|
| 103 Everett Street Rt | -- | None Available | |
| 103 Everett Street Rt | -- | None Available | |
| 103 Everett Street Rt | -- | None Available | |
| Dicostanzo Mario | $25,000 | -- | |
| Dicostanzo Mario | $25,000 | -- | |
| Key Fin Servs Inc | $120,000 | -- | |
| Key Fin Servs Inc | $120,000 | -- | |
| Atkinson Ian | $178,000 | -- | |
| Chrysler First Fin | $152,000 | -- |
Source: Public Records
Mortgage History
| Date | Status | Borrower | Loan Amount |
|---|---|---|---|
| Previous Owner | Chrysler First Fin | $178,000 | |
| Previous Owner | Chrysler First Fin | $56,500 | |
| Previous Owner | Chrysler First Fin | $49,000 |
Source: Public Records
Tax History Compared to Growth
Tax History
| Year | Tax Paid | Tax Assessment Tax Assessment Total Assessment is a certain percentage of the fair market value that is determined by local assessors to be the total taxable value of land and additions on the property. | Land | Improvement |
|---|---|---|---|---|
| 2025 | $7,813 | $861,400 | $261,500 | $599,900 |
| 2024 | $7,389 | $811,100 | $229,800 | $581,300 |
| 2023 | $7,427 | $781,000 | $199,700 | $581,300 |
| 2022 | $7,348 | $706,500 | $190,200 | $516,300 |
| 2021 | $7,131 | $644,800 | $174,300 | $470,500 |
| 2020 | $6,862 | $609,400 | $158,500 | $450,900 |
| 2019 | $6,191 | $511,200 | $142,600 | $368,600 |
| 2018 | $5,873 | $453,200 | $117,300 | $335,900 |
| 2017 | $4,639 | $331,600 | $101,400 | $230,200 |
| 2016 | $3,836 | $265,500 | $91,900 | $173,600 |
| 2015 | $3,929 | $265,500 | $91,900 | $173,600 |
Source: Public Records
Map
Nearby Homes
- 83 Shirley Ave
- 10 Franklin Ave Unit 403
- 10 Franklin Ave Unit G10
- 10 Franklin Ave Unit 404
- 10 Franklin Ave Unit 402
- 10 Franklin Ave Unit 107
- 37 Franklin Ave
- 43 Kimball Ave Unit 2
- 419 Lee Burbank Hwy
- 95 Harris St
- 224 Harris St
- 6 Garfield Ave
- 74 Garfield Ave
- 71 Revere Beach Blvd Unit 11
- 376 Ocean Ave Unit 709
- 376 Ocean Ave Unit 1615
- 92 Tuttle St
- 10 Ocean Ave Unit 213
- 10 Ocean Ave Unit 203
- 90 Atwood St
- 56 Thornton St
- 46 Thornton St
- 42 Thornton St
- 60 Thornton St Unit 3
- 57 Highland St
- 53 Highland St
- 61 Highland St
- 61 Highland St Unit 2
- 61 Highland St Unit 1
- 38 Thornton St
- 62 Thornton St
- 63 Thornton St
- 65 Highland St
- 65 Highland St Unit 2
- 65 Highland St Unit 1
- 65 Highland St Unit 3
- 51 Thornton St
- 51 Thornton St Unit 3
- 51 Thornton St Unit 1
- 51 Thornton St Unit 2