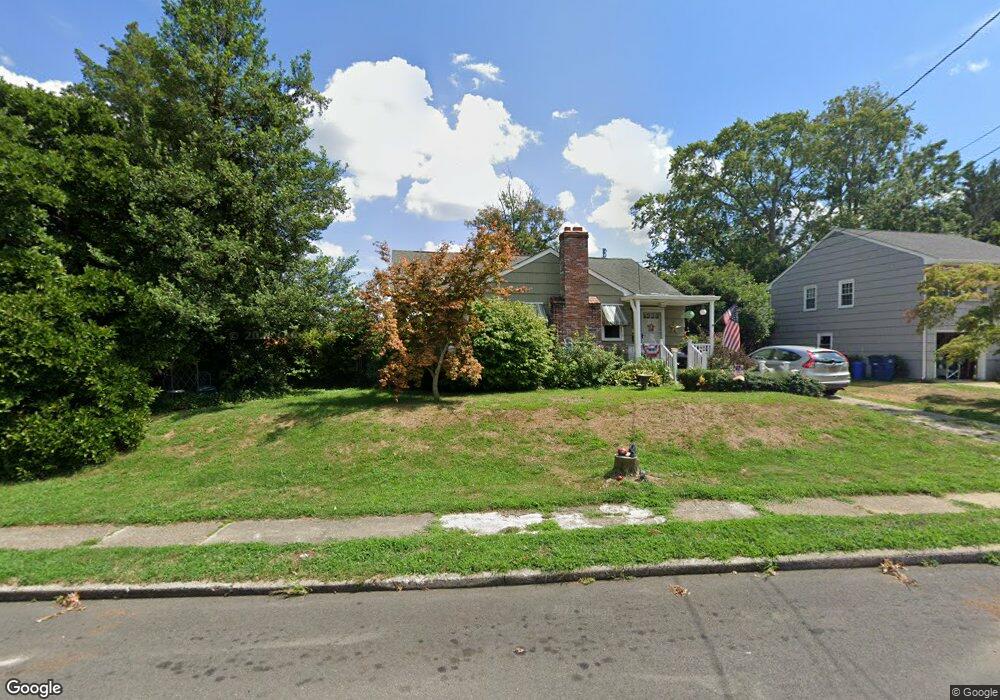
52 Tinker Dr Mount Holly, NJ 08060
Estimated Value: $353,000 - $372,000
--
Bed
--
Bath
1,404
Sq Ft
$260/Sq Ft
Est. Value
About This Home
This home is located at 52 Tinker Dr, Mount Holly, NJ 08060 and is currently estimated at $364,542, approximately $259 per square foot. 52 Tinker Dr is a home located in Burlington County with nearby schools including John Brainerd Elementary School, Folwell Elementary School, and F.W. Holbein School.
Ownership History
Date
Name
Owned For
Owner Type
Purchase Details
Closed on
Nov 26, 2008
Sold by
Matthews Herbert W and Matthews Kay
Bought by
Doan Charles H and Doan Anastasia M
Current Estimated Value
Purchase Details
Closed on
Aug 31, 2004
Sold by
Pallante Brian K and Pallante Marianne
Bought by
Cramer Mark C and Cramer Eileen R
Home Financials for this Owner
Home Financials are based on the most recent Mortgage that was taken out on this home.
Original Mortgage
$100,000
Interest Rate
6.02%
Mortgage Type
Purchase Money Mortgage
Purchase Details
Closed on
May 30, 1996
Sold by
Hoffmannand Joseph W and Hoffmann Joanne M
Bought by
Pallante Brian K and Pallante Marianne
Create a Home Valuation Report for This Property
The Home Valuation Report is an in-depth analysis detailing your home's value as well as a comparison with similar homes in the area
Home Values in the Area
Average Home Value in this Area
Purchase History
| Date | Buyer | Sale Price | Title Company |
|---|---|---|---|
| Doan Charles H | $200,000 | Group 21 Title Agency | |
| Cramer Mark C | $190,000 | -- | |
| Pallante Brian K | $101,500 | -- |
Source: Public Records
Mortgage History
| Date | Status | Borrower | Loan Amount |
|---|---|---|---|
| Previous Owner | Cramer Mark C | $100,000 |
Source: Public Records
Tax History Compared to Growth
Tax History
| Year | Tax Paid | Tax Assessment Tax Assessment Total Assessment is a certain percentage of the fair market value that is determined by local assessors to be the total taxable value of land and additions on the property. | Land | Improvement |
|---|---|---|---|---|
| 2025 | $7,731 | $220,200 | $63,100 | $157,100 |
| 2024 | $7,390 | $220,200 | $63,100 | $157,100 |
| 2023 | $7,390 | $220,200 | $63,100 | $157,100 |
| 2022 | $7,130 | $220,200 | $63,100 | $157,100 |
| 2021 | $7,013 | $220,200 | $63,100 | $157,100 |
| 2020 | $6,740 | $220,200 | $63,100 | $157,100 |
| 2019 | $6,588 | $220,200 | $63,100 | $157,100 |
| 2018 | $6,472 | $220,200 | $63,100 | $157,100 |
| 2017 | $6,304 | $220,200 | $63,100 | $157,100 |
| 2016 | $6,159 | $220,200 | $63,100 | $157,100 |
| 2015 | $6,029 | $220,200 | $63,100 | $157,100 |
| 2014 | $5,807 | $220,200 | $63,100 | $157,100 |
Source: Public Records
Map
Nearby Homes