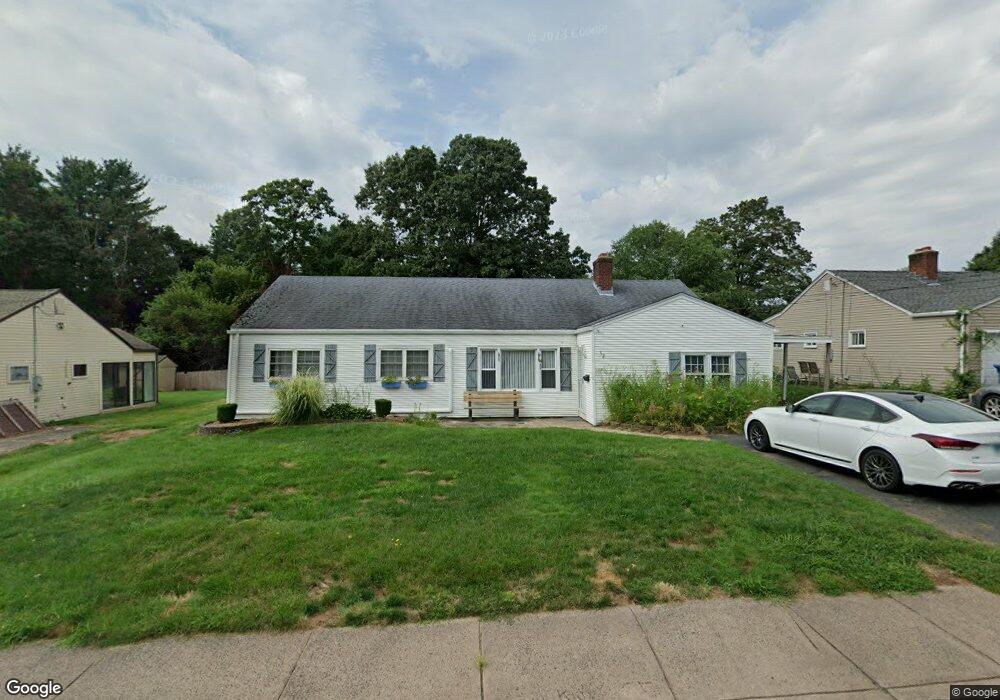
52 Weaver Rd Manchester, CT 06042
Buckley District NeighborhoodEstimated Value: $300,000 - $369,000
3
Beds
2
Baths
2,130
Sq Ft
$158/Sq Ft
Est. Value
About This Home
This home is located at 52 Weaver Rd, Manchester, CT 06042 and is currently estimated at $336,032, approximately $157 per square foot. 52 Weaver Rd is a home located in Hartford County with nearby schools including Buckley School, Illing Middle School, and Elisabeth M. Bennet Academy.
Ownership History
Date
Name
Owned For
Owner Type
Purchase Details
Closed on
Jul 1, 1999
Sold by
Meadan Richard M and Meadan Kathleen E
Bought by
Wilson Dina L
Current Estimated Value
Purchase Details
Closed on
Jun 1, 1993
Sold by
Mcadam Helen M
Bought by
Mcadam Richard A and Mcadam Kathleen E
Create a Home Valuation Report for This Property
The Home Valuation Report is an in-depth analysis detailing your home's value as well as a comparison with similar homes in the area
Home Values in the Area
Average Home Value in this Area
Purchase History
| Date | Buyer | Sale Price | Title Company |
|---|---|---|---|
| Wilson Dina L | $94,900 | -- | |
| Wilson Dina L | $94,900 | -- | |
| Mcadam Richard A | $95,000 | -- | |
| Mcadam Richard A | $95,000 | -- |
Source: Public Records
Mortgage History
| Date | Status | Borrower | Loan Amount |
|---|---|---|---|
| Open | Mcadam Richard A | $25,000 | |
| Open | Mcadam Richard A | $169,312 | |
| Closed | Mcadam Richard A | $150,000 |
Source: Public Records
Tax History
| Year | Tax Paid | Tax Assessment Tax Assessment Total Assessment is a certain percentage of the fair market value that is determined by local assessors to be the total taxable value of land and additions on the property. | Land | Improvement |
|---|---|---|---|---|
| 2025 | $6,933 | $174,100 | $38,900 | $135,200 |
| 2024 | $6,734 | $174,100 | $38,900 | $135,200 |
| 2023 | $6,477 | $174,100 | $38,900 | $135,200 |
| 2022 | $6,288 | $174,100 | $38,900 | $135,200 |
| 2021 | $5,937 | $141,600 | $33,300 | $108,300 |
| 2020 | $5,929 | $141,600 | $33,300 | $108,300 |
| 2019 | $5,905 | $141,600 | $33,300 | $108,300 |
| 2018 | $5,793 | $141,600 | $33,300 | $108,300 |
| 2017 | $5,629 | $141,600 | $33,300 | $108,300 |
| 2016 | $5,262 | $132,600 | $42,400 | $90,200 |
| 2015 | $5,224 | $132,600 | $42,400 | $90,200 |
| 2014 | $5,125 | $132,600 | $42,400 | $90,200 |
Source: Public Records
Map
Nearby Homes
- 29 Constance Dr
- 4 Buckingham St
- 52 Gerard St
- 257 Green Rd
- 85 Lydall St
- 9 Robin Rd
- 143 Boulder Rd
- 28 Elwood Rd
- 110 Greenwood Dr
- 25 Greenwood Dr
- 86 Doane St
- 62 Ambassador Dr Unit D
- 74 Overlook Dr
- 49 Cliffside Dr Unit B
- 81 Cliffside Dr Unit A
- 85 Henry St
- 150 Summit St
- 40 Grove St Unit B
- 195 Oakland St Unit A
- 67 Bissell St
Your Personal Tour Guide
Ask me questions while you tour the home.