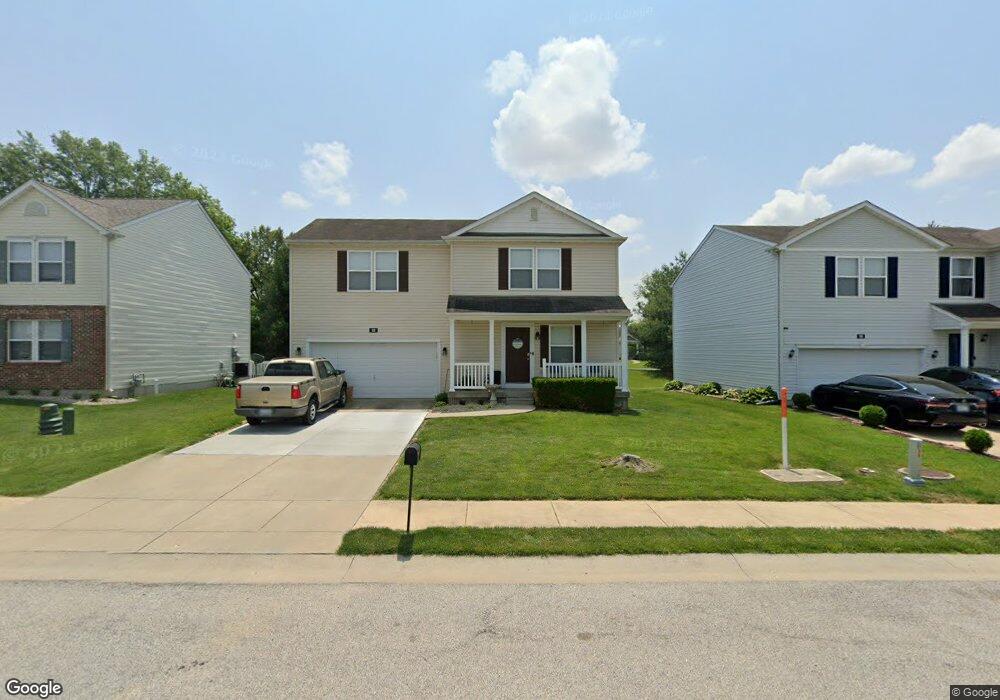
52 Westhaven Meadows Dr Belleville, IL 62220
Estimated Value: $203,000 - $253,000
--
Bed
--
Bath
1,120
Sq Ft
$212/Sq Ft
Est. Value
About This Home
This home is located at 52 Westhaven Meadows Dr, Belleville, IL 62220 and is currently estimated at $236,941, approximately $211 per square foot. 52 Westhaven Meadows Dr is a home located in St. Clair County with nearby schools including Westhaven Elementary School, Central Jr High School, and Notre Dame Academy of Belleville.
Ownership History
Date
Name
Owned For
Owner Type
Purchase Details
Closed on
Nov 25, 2015
Sold by
Vonbokel Jerry N
Bought by
Vonbokel Jerry N
Current Estimated Value
Home Financials for this Owner
Home Financials are based on the most recent Mortgage that was taken out on this home.
Original Mortgage
$152,000
Outstanding Balance
$111,223
Interest Rate
4.37%
Mortgage Type
New Conventional
Estimated Equity
$125,718
Purchase Details
Closed on
May 24, 2010
Sold by
Oconnor Michael D and Oconnor Amanda J
Bought by
Vonbokel Jerry N
Home Financials for this Owner
Home Financials are based on the most recent Mortgage that was taken out on this home.
Original Mortgage
$162,807
Interest Rate
5.3%
Mortgage Type
FHA
Purchase Details
Closed on
May 25, 2006
Sold by
The Jones Co Homes Llc
Bought by
Oconnor Michael D and Oconnor Amanda J
Home Financials for this Owner
Home Financials are based on the most recent Mortgage that was taken out on this home.
Original Mortgage
$160,154
Interest Rate
6.62%
Mortgage Type
Fannie Mae Freddie Mac
Create a Home Valuation Report for This Property
The Home Valuation Report is an in-depth analysis detailing your home's value as well as a comparison with similar homes in the area
Home Values in the Area
Average Home Value in this Area
Purchase History
| Date | Buyer | Sale Price | Title Company |
|---|---|---|---|
| Vonbokel Jerry N | -- | Nations Title Agency Mo Inc | |
| Vonbokel Jerry N | $165,000 | Advanced Title Solutions Inc | |
| Oconnor Michael D | $160,500 | Commerce Land Title Inc |
Source: Public Records
Mortgage History
| Date | Status | Borrower | Loan Amount |
|---|---|---|---|
| Open | Vonbokel Jerry N | $152,000 | |
| Closed | Vonbokel Jerry N | $162,807 | |
| Previous Owner | Oconnor Michael D | $160,154 |
Source: Public Records
Tax History Compared to Growth
Tax History
| Year | Tax Paid | Tax Assessment Tax Assessment Total Assessment is a certain percentage of the fair market value that is determined by local assessors to be the total taxable value of land and additions on the property. | Land | Improvement |
|---|---|---|---|---|
| 2024 | $5,228 | $65,447 | $8,683 | $56,764 |
| 2023 | $5,123 | $60,574 | $8,511 | $52,063 |
| 2022 | $4,645 | $54,532 | $7,662 | $46,870 |
| 2021 | $4,428 | $50,413 | $7,083 | $43,330 |
| 2020 | $4,279 | $47,674 | $6,698 | $40,976 |
| 2019 | $3,978 | $44,396 | $6,708 | $37,688 |
| 2018 | $3,876 | $43,436 | $6,563 | $36,873 |
| 2017 | $3,847 | $43,131 | $6,517 | $36,614 |
| 2016 | $3,793 | $42,215 | $6,379 | $35,836 |
| 2014 | $3,612 | $45,060 | $7,821 | $37,239 |
| 2013 | $3,624 | $45,705 | $7,933 | $37,772 |
Source: Public Records
Map
Nearby Homes
- 91-110 Westhaven Meadows Dr
- 46 Meadowview Dr
- 1617 S Illinois St
- 1433 Fairwood Dr
- 1620 Westhaven Dr
- 1412 Fairwood Dr
- 2056 Celebration Park Cir
- 1500 State Street Rd
- 1937 Richmond Springs Ln
- 133 Rivermeade Ln
- 1250 Lakeshore Dr
- 1909 Plantation Ln
- 1913 Plantation Ln
- 304 S Belt W
- 33 Forest Gate Dr
- 2042 Woodsong Way Ln
- 244 River Laurel Dr
- 403 W Van Buren St
- 1031 S Charles St
- 928 S High St
- 48 Westhaven Meadows Dr
- 56 Westhaven Meadows Dr
- 44 Westhaven Meadows Dr Unit Lt 135
- 44 Westhaven Meadows Dr
- 60 Westhaven Meadows Dr
- 51 Westhaven Meadows Dr
- 47 Westhaven Meadows Dr
- 40 Westhaven Meadows Dr Unit Lt 136
- 40 Westhaven Meadows Dr
- 55 Westhaven Meadows Dr
- 43 Westhaven Meadows Dr
- 52 Maple Dr
- 64 Westhaven Meadows Dr
- 36 Westhaven Meadows Dr
- 39 Westhaven Meadows Dr
- 44 Maple Dr
- 36 Maple Dr
- 35 Westhaven Meadows Dr
- 50 Meadowview Dr
- 32 Maple Dr