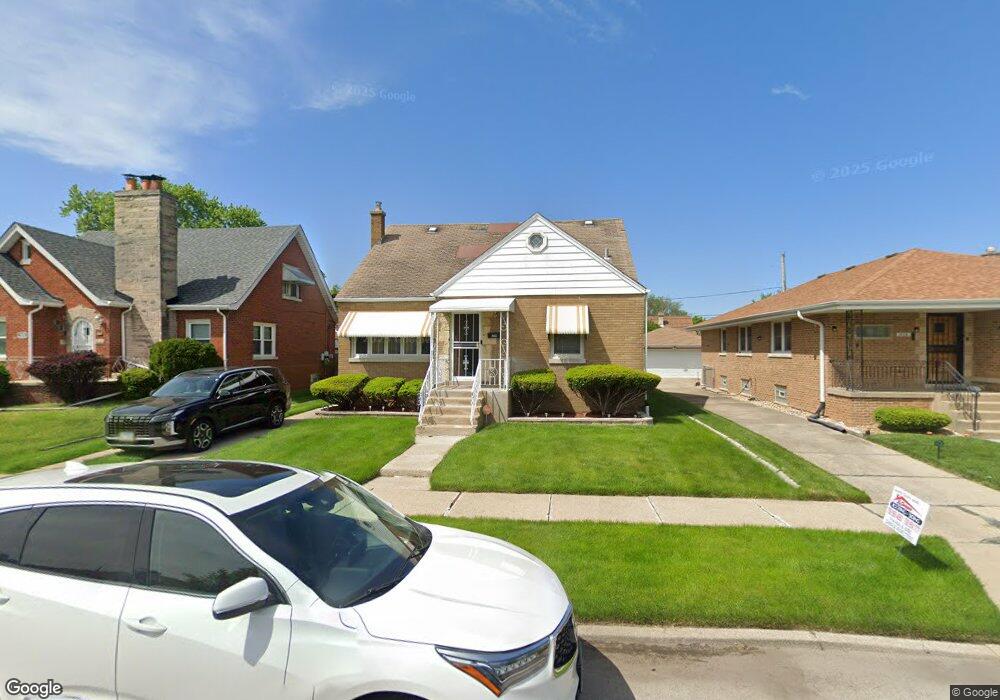
520 157th St Calumet City, IL 60409
Estimated Value: $138,000 - $157,000
2
Beds
1
Bath
784
Sq Ft
$192/Sq Ft
Est. Value
About This Home
This home is located at 520 157th St, Calumet City, IL 60409 and is currently estimated at $150,622, approximately $192 per square foot. 520 157th St is a home located in Cook County with nearby schools including Lincoln Elementary School, Thornton Fractional North High School, and Hammond Academy Of Science & Tech.
Ownership History
Date
Name
Owned For
Owner Type
Purchase Details
Closed on
Sep 10, 2004
Sold by
Smolinski Sally A
Bought by
Bradford Donella A
Current Estimated Value
Home Financials for this Owner
Home Financials are based on the most recent Mortgage that was taken out on this home.
Original Mortgage
$117,800
Outstanding Balance
$72,991
Interest Rate
9.87%
Mortgage Type
Unknown
Estimated Equity
$77,631
Purchase Details
Closed on
Dec 28, 1999
Sold by
Smolinski Joseph S and Smolinski Sally A
Bought by
Smolinski Joseph S and Smolinski Sally A
Create a Home Valuation Report for This Property
The Home Valuation Report is an in-depth analysis detailing your home's value as well as a comparison with similar homes in the area
Home Values in the Area
Average Home Value in this Area
Purchase History
| Date | Buyer | Sale Price | Title Company |
|---|---|---|---|
| Bradford Donella A | $124,000 | Atgf Inc | |
| Smolinski Sally A | -- | Atgf Inc | |
| Smolinski Joseph S | -- | -- |
Source: Public Records
Mortgage History
| Date | Status | Borrower | Loan Amount |
|---|---|---|---|
| Open | Bradford Donella A | $117,800 |
Source: Public Records
Tax History Compared to Growth
Tax History
| Year | Tax Paid | Tax Assessment Tax Assessment Total Assessment is a certain percentage of the fair market value that is determined by local assessors to be the total taxable value of land and additions on the property. | Land | Improvement |
|---|---|---|---|---|
| 2024 | $2,402 | $6,000 | $1,220 | $4,780 |
| 2023 | $1,375 | $6,000 | $1,220 | $4,780 |
| 2022 | $1,375 | $3,610 | $1,068 | $2,542 |
| 2021 | $1,436 | $3,609 | $1,067 | $2,542 |
| 2020 | $1,418 | $3,609 | $1,067 | $2,542 |
| 2019 | $1,197 | $3,370 | $991 | $2,379 |
| 2018 | $1,177 | $3,370 | $991 | $2,379 |
| 2017 | $1,155 | $3,370 | $991 | $2,379 |
| 2016 | $1,453 | $3,495 | $915 | $2,580 |
| 2015 | $1,363 | $3,495 | $915 | $2,580 |
| 2014 | $1,379 | $3,495 | $915 | $2,580 |
| 2013 | $1,538 | $4,030 | $915 | $3,115 |
Source: Public Records
Map
Nearby Homes