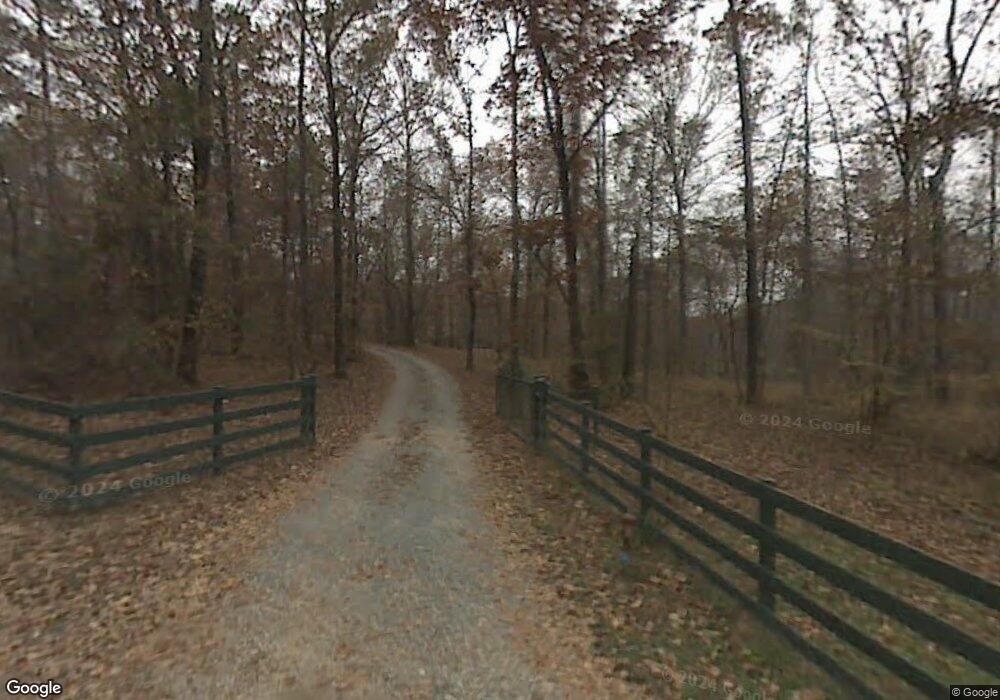
520 Bent Oaks Ln Benton, AR 72019
Estimated Value: $374,750 - $419,000
--
Bed
3
Baths
2,625
Sq Ft
$150/Sq Ft
Est. Value
About This Home
This home is located at 520 Bent Oaks Ln, Benton, AR 72019 and is currently estimated at $393,583, approximately $149 per square foot. 520 Bent Oaks Ln is a home located in Saline County with nearby schools including Benton Middle School, Caldwell Elementary School, and Benton Junior High School.
Ownership History
Date
Name
Owned For
Owner Type
Purchase Details
Closed on
Aug 8, 2025
Sold by
Hollinger Ty and Hollinger Jeffery Ty
Bought by
Hollinger Jeffery Ty
Current Estimated Value
Home Financials for this Owner
Home Financials are based on the most recent Mortgage that was taken out on this home.
Original Mortgage
$75,000
Outstanding Balance
$74,850
Interest Rate
6.67%
Mortgage Type
New Conventional
Estimated Equity
$318,733
Purchase Details
Closed on
Jun 19, 2017
Sold by
Hollinger Tara
Bought by
Hollinger Ty
Purchase Details
Closed on
Feb 25, 2013
Sold by
Hollinger Ty and Hollinger Tara
Bought by
Phillips Fay E
Purchase Details
Closed on
Sep 6, 2006
Sold by
Hollinger Ty and Hollinger Tara L
Bought by
Hollinger Ty and Hollinger Tara L
Home Financials for this Owner
Home Financials are based on the most recent Mortgage that was taken out on this home.
Original Mortgage
$245,000
Interest Rate
6.55%
Mortgage Type
New Conventional
Purchase Details
Closed on
Mar 1, 1992
Bought by
Correction
Create a Home Valuation Report for This Property
The Home Valuation Report is an in-depth analysis detailing your home's value as well as a comparison with similar homes in the area
Home Values in the Area
Average Home Value in this Area
Purchase History
| Date | Buyer | Sale Price | Title Company |
|---|---|---|---|
| Hollinger Jeffery Ty | -- | None Listed On Document | |
| Hollinger Ty | -- | None Available | |
| Phillips Fay E | -- | None Available | |
| Hollinger Ty | -- | -- | |
| Hollinger Ty | $245,000 | -- | |
| Correction | -- | -- | |
| Nantze | -- | -- |
Source: Public Records
Mortgage History
| Date | Status | Borrower | Loan Amount |
|---|---|---|---|
| Open | Hollinger Jeffery Ty | $75,000 | |
| Previous Owner | Hollinger Ty | $245,000 |
Source: Public Records
Tax History Compared to Growth
Tax History
| Year | Tax Paid | Tax Assessment Tax Assessment Total Assessment is a certain percentage of the fair market value that is determined by local assessors to be the total taxable value of land and additions on the property. | Land | Improvement |
|---|---|---|---|---|
| 2025 | $2,109 | $40,880 | $1,680 | $39,200 |
| 2024 | $2,109 | $40,880 | $1,680 | $39,200 |
| 2023 | $1,786 | $40,880 | $1,680 | $39,200 |
| 2022 | $1,836 | $40,880 | $1,680 | $39,200 |
| 2021 | $2,060 | $45,220 | $3,420 | $41,800 |
| 2020 | $2,010 | $45,220 | $3,420 | $41,800 |
| 2019 | $2,010 | $45,220 | $3,420 | $41,800 |
| 2018 | $1,968 | $45,220 | $3,420 | $41,800 |
| 2017 | $1,866 | $45,220 | $3,420 | $41,800 |
| 2016 | $2,063 | $39,990 | $3,460 | $36,530 |
| 2015 | $2,063 | $39,990 | $3,460 | $36,530 |
| 2014 | $1,765 | $39,990 | $3,460 | $36,530 |
Source: Public Records
Map
Nearby Homes
- 1528 Brookshire Dr
- Lot 3 Abrielle Ln
- 854 Salem Heights Dr
- 301 Abrielle Ln
- 522 Valley Hill Rd
- 401 Kale Cove
- 8616 Old Congo Rd
- 31 Ac. River Ridge Rd
- 1611 River Ridge Rd
- 6047 Charley Place
- 1270 Fern Creek Dr
- 1121 Essex Dr
- 1109 Essex Dr
- 696 Mulberry Salem Rd
- 2025 Seven Gables
- 7008 Hannah Ln
- 5947 Beth Ln
- 5751 Ridgeway Dr
- 2173 N Fork Cir
- 208 Clearview
- 1544 Brookshire Dr
- 1552 Brookshire Dr
- 1536 Brookshire Dr
- 1568 Brookshire Dr
- 220 Bent Oaks Ln
- 1576 Brookshire Dr
- 1545 Brookshire Dr
- 1553 Brookshire Dr
- 1537 Brookshire Dr
- 1569 Brookshire Dr
- 1525 Brookshire Dr
- 0 Brookshire Unit 15031176
- 0 Brookshire Unit 16005638
- 0 Brookshire Unit 16008763
- 0 Brookshire Unit 21002403
- 1710 Yorkshire Dr
- 1580 Brookshire Dr
- 425 Bent Oaks Ln
- 8319 Country Cove
- 1577 Brookshire Dr