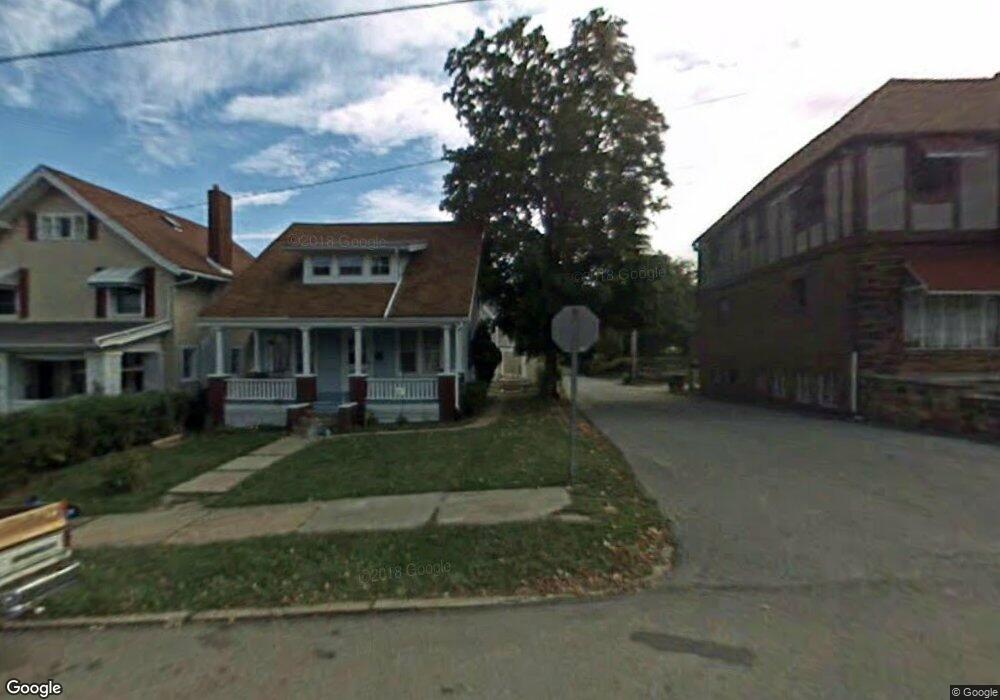
520 Bissman Ct Unit 522 Mansfield, OH 44903
Estimated Value: $69,000 - $166,000
5
Beds
2
Baths
2,059
Sq Ft
$51/Sq Ft
Est. Value
About This Home
This home is located at 520 Bissman Ct Unit 522, Mansfield, OH 44903 and is currently estimated at $105,537, approximately $51 per square foot. 520 Bissman Ct Unit 522 is a home located in Richland County with nearby schools including Goal Digital Academy, Mansfield Elective Academy, and St. Peter's High School/Junior High.
Ownership History
Date
Name
Owned For
Owner Type
Purchase Details
Closed on
Apr 11, 2007
Sold by
American General Financial Services Inc
Bought by
Surgener Finley R and Surgener Kari
Current Estimated Value
Home Financials for this Owner
Home Financials are based on the most recent Mortgage that was taken out on this home.
Original Mortgage
$23,600
Outstanding Balance
$14,301
Interest Rate
6.19%
Mortgage Type
Purchase Money Mortgage
Estimated Equity
$91,236
Purchase Details
Closed on
Feb 24, 2006
Sold by
Mills Douglas P
Bought by
American General Financial Services Inc
Purchase Details
Closed on
Jul 17, 2000
Sold by
Boggs Roderic G
Bought by
Mills Douglas P
Home Financials for this Owner
Home Financials are based on the most recent Mortgage that was taken out on this home.
Original Mortgage
$19,800
Interest Rate
8.55%
Mortgage Type
New Conventional
Purchase Details
Closed on
Nov 29, 1996
Sold by
Little Lgeorge R
Bought by
Boggs Roderic G and Boggs Amy J
Create a Home Valuation Report for This Property
The Home Valuation Report is an in-depth analysis detailing your home's value as well as a comparison with similar homes in the area
Home Values in the Area
Average Home Value in this Area
Purchase History
| Date | Buyer | Sale Price | Title Company |
|---|---|---|---|
| Surgener Finley R | $29,500 | Southern Title | |
| American General Financial Services Inc | -- | None Available | |
| Mills Douglas P | $22,000 | -- | |
| Boggs Roderic G | $16,100 | -- |
Source: Public Records
Mortgage History
| Date | Status | Borrower | Loan Amount |
|---|---|---|---|
| Open | Surgener Finley R | $23,600 | |
| Previous Owner | Mills Douglas P | $19,800 |
Source: Public Records
Tax History Compared to Growth
Tax History
| Year | Tax Paid | Tax Assessment Tax Assessment Total Assessment is a certain percentage of the fair market value that is determined by local assessors to be the total taxable value of land and additions on the property. | Land | Improvement |
|---|---|---|---|---|
| 2024 | $831 | $17,360 | $1,070 | $16,290 |
| 2023 | $831 | $17,360 | $1,070 | $16,290 |
| 2022 | $792 | $13,870 | $1,040 | $12,830 |
| 2021 | $798 | $13,870 | $1,040 | $12,830 |
| 2020 | $816 | $13,870 | $1,040 | $12,830 |
| 2019 | $904 | $13,870 | $1,040 | $12,830 |
| 2018 | $892 | $13,870 | $1,040 | $12,830 |
| 2017 | $869 | $13,870 | $1,040 | $12,830 |
| 2016 | $911 | $14,100 | $1,910 | $12,190 |
| 2015 | $870 | $14,100 | $1,910 | $12,190 |
| 2014 | $858 | $14,100 | $1,910 | $12,190 |
| 2012 | $346 | $14,850 | $2,020 | $12,830 |
Source: Public Records
Map
Nearby Homes
- 80 Rowland Ave
- 96 Helen Ave
- 24 Stewart Ave S
- 120 Gettings Place
- 21 Glenwood Blvd
- 38 Baldwin Ave
- 611 Park Ave W
- 37 Baldwin Ave
- 76 Bartley Ave
- 406 Sherman Place
- 88 Sherman Ave
- 71 Glenwood Blvd
- 41 Parkwood Blvd
- 126 Dawson Ave
- 132 Sycamore St
- 237 Helen Ave
- 114 Vennum Ave
- 118 Parkwood Blvd
- 118 Lind Ave
- 450 Glessner Ave