Estimated Value: $128,000 - $151,000
3
Beds
2
Baths
1,196
Sq Ft
$117/Sq Ft
Est. Value
About This Home
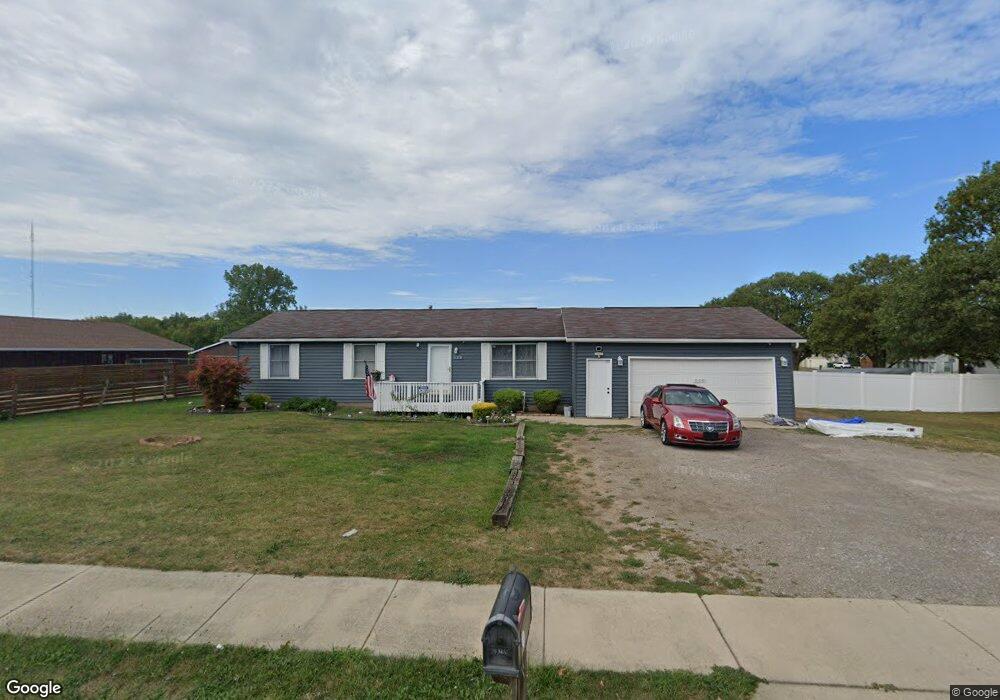
This home is located at 520 Brower Rd, Lima, OH 45801 and is currently estimated at $139,707, approximately $116 per square foot. 520 Brower Rd is a home located in Allen County with nearby schools including Elida Elementary School, Elida Middle School, and Elida High School.
Ownership History
Date
Name
Owned For
Owner Type
Purchase Details
Closed on
Dec 12, 2013
Sold by
Veloz Correa Serfafin and Veloz Correa Joaquina
Bought by
Veloz Maria Cristina
Current Estimated Value
Purchase Details
Closed on
Sep 16, 2013
Sold by
Veloz Correa Serafin
Bought by
Veloz Padilla Francisco J
Purchase Details
Closed on
May 27, 2009
Sold by
Vision 3 Investments Llc
Bought by
Veloz Correa Serafin
Purchase Details
Closed on
Nov 17, 2008
Sold by
Citimortgage Inc
Bought by
Vision 3 Investments Llc
Purchase Details
Closed on
Oct 1, 2008
Sold by
Hengstebeck David A and Hengstebeck Christine L
Bought by
Citimortgage Inc
Purchase Details
Closed on
Jul 10, 1998
Sold by
Hayes Peter
Bought by
Hengstebeck David and Hengstebeck Christine
Home Financials for this Owner
Home Financials are based on the most recent Mortgage that was taken out on this home.
Original Mortgage
$62,220
Interest Rate
7.17%
Mortgage Type
VA
Purchase Details
Closed on
May 22, 1992
Bought by
Hayes Peter E
Create a Home Valuation Report for This Property
The Home Valuation Report is an in-depth analysis detailing your home's value as well as a comparison with similar homes in the area
Purchase History
| Date | Buyer | Sale Price | Title Company |
|---|---|---|---|
| Veloz Maria Cristina | -- | None Available | |
| Veloz Padilla Francisco J | -- | None Available | |
| Veloz Correa Serafin | $54,000 | Attorney | |
| Vision 3 Investments Llc | $24,900 | Chicago Title | |
| Citimortgage Inc | $31,534 | None Available | |
| Hengstebeck David | $61,000 | -- | |
| Hayes Peter E | $59,500 | -- |
Source: Public Records
Mortgage History
| Date | Status | Borrower | Loan Amount |
|---|---|---|---|
| Previous Owner | Hengstebeck David | $62,220 |
Source: Public Records
Tax History
| Year | Tax Paid | Tax Assessment Tax Assessment Total Assessment is a certain percentage of the fair market value that is determined by local assessors to be the total taxable value of land and additions on the property. | Land | Improvement |
|---|---|---|---|---|
| 2024 | $1,563 | $35,670 | $6,300 | $29,370 |
| 2023 | $1,683 | $33,960 | $5,990 | $27,970 |
| 2022 | $1,742 | $33,960 | $5,990 | $27,970 |
| 2021 | $1,792 | $33,960 | $5,990 | $27,970 |
| 2020 | $2,185 | $29,580 | $5,460 | $24,120 |
| 2019 | $2,185 | $29,580 | $5,460 | $24,120 |
| 2018 | $1,593 | $29,580 | $5,460 | $24,120 |
| 2017 | $1,470 | $27,370 | $5,460 | $21,910 |
| 2016 | $1,829 | $27,370 | $5,460 | $21,910 |
| 2015 | $1,410 | $27,370 | $5,460 | $21,910 |
| 2014 | $1,410 | $25,870 | $5,250 | $20,620 |
| 2013 | $1,266 | $25,870 | $5,250 | $20,620 |
Source: Public Records
Map
Nearby Homes
- 1705 Karen St
- 475 Kenmore St
- 520 Kenmore St
- 207 W Lane Ave
- 1014 Brower Rd
- 2380 Mandolin Dr
- 2300 Mandolin Dr
- 2371 Mandolin Dr
- 1317 Virginia Ave
- 1889 N Metcalf St
- 1143 Brower Rd
- 1212 Virginia Ave
- 1435 N Central Ave
- 608 W O'Connor Ave
- 645 W O'Connor Ave
- 760 W O'Connor Ave
- 576 W Ashton Ave
- 1164 Bahama Dr
- 557 W Ashton Ave
- 1021 N McDonel St
Your Personal Tour Guide
Ask me questions while you tour the home.