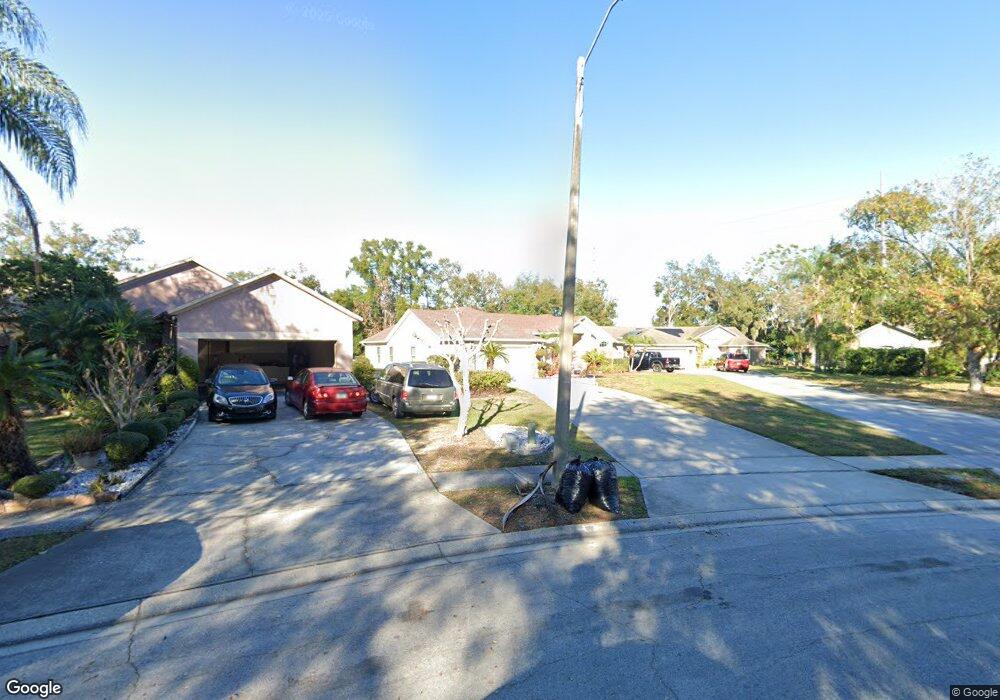
520 Canby Cir Ocoee, FL 34761
West Oaks NeighborhoodEstimated Value: $394,005 - $433,000
4
Beds
2
Baths
1,900
Sq Ft
$215/Sq Ft
Est. Value
About This Home
This home is located at 520 Canby Cir, Ocoee, FL 34761 and is currently estimated at $407,751, approximately $214 per square foot. 520 Canby Cir is a home located in Orange County with nearby schools including Citrus Elementary School, Ocoee Middle School, and Ocoee High School.
Ownership History
Date
Name
Owned For
Owner Type
Purchase Details
Closed on
Apr 16, 2015
Sold by
Collins Deabreu Elizabeth
Bought by
Collins Deabreu Elizabeth and Chin Tala
Current Estimated Value
Purchase Details
Closed on
Mar 4, 2010
Sold by
Deabreu Kenneth I
Bought by
Collins De Abreu Elizabeth
Purchase Details
Closed on
Sep 30, 2003
Sold by
Harris Clifton and Harris Sarah A
Bought by
Deabreu Kenneth I and Collins De Abreu Elizabeth
Home Financials for this Owner
Home Financials are based on the most recent Mortgage that was taken out on this home.
Original Mortgage
$117,750
Outstanding Balance
$55,363
Interest Rate
6.32%
Mortgage Type
Unknown
Estimated Equity
$352,388
Purchase Details
Closed on
Aug 8, 1996
Sold by
Temple Grove Estates Joint Venture
Bought by
Harris Clifton and Harris Sarah A
Home Financials for this Owner
Home Financials are based on the most recent Mortgage that was taken out on this home.
Original Mortgage
$118,000
Interest Rate
8.24%
Mortgage Type
VA
Create a Home Valuation Report for This Property
The Home Valuation Report is an in-depth analysis detailing your home's value as well as a comparison with similar homes in the area
Home Values in the Area
Average Home Value in this Area
Purchase History
| Date | Buyer | Sale Price | Title Company |
|---|---|---|---|
| Collins Deabreu Elizabeth | -- | None Available | |
| Collins De Abreu Elizabeth | -- | None Available | |
| Deabreu Kenneth I | $157,000 | Premier Title & Abstract Inc | |
| Harris Clifton | $115,800 | -- |
Source: Public Records
Mortgage History
| Date | Status | Borrower | Loan Amount |
|---|---|---|---|
| Open | Deabreu Kenneth I | $117,750 | |
| Previous Owner | Harris Clifton | $118,000 |
Source: Public Records
Tax History
| Year | Tax Paid | Tax Assessment Tax Assessment Total Assessment is a certain percentage of the fair market value that is determined by local assessors to be the total taxable value of land and additions on the property. | Land | Improvement |
|---|---|---|---|---|
| 2025 | $2,929 | $185,587 | -- | -- |
| 2024 | $2,576 | $180,357 | -- | -- |
| 2023 | $2,576 | $170,169 | $0 | $0 |
| 2022 | $2,557 | $165,213 | $0 | $0 |
| 2021 | $2,525 | $160,401 | $0 | $0 |
| 2020 | $2,411 | $158,186 | $0 | $0 |
| 2019 | $2,492 | $154,630 | $0 | $0 |
| 2018 | $2,480 | $151,747 | $0 | $0 |
| 2017 | $2,462 | $178,177 | $40,000 | $138,177 |
| 2016 | $2,466 | $145,569 | $25,000 | $120,569 |
| 2015 | $1,726 | $126,514 | $14,000 | $112,514 |
| 2014 | $1,716 | $106,785 | $8,000 | $98,785 |
Source: Public Records
Map
Nearby Homes
- 2637 Florence St
- 2356 Alclobe Cir Unit 2
- 2370 Alclobe Cir
- 2517 Greywall Ave
- 2710 Springfield Dr
- 2546 Alclobe Cir
- 2663 Greywall Ave
- 1872 Ibis Bay Ct
- 2508 Good Homes Rd
- 2188 Eh Pounds Dr
- 1823 Ibis Bay Ct
- 1801 E Silver Star Rd Unit 1
- 8356 Silver Star Rd
- 528 Herring Gull Ct
- 1925 Natchez Trace Blvd
- 2538 Dovetail Dr
- 1000 Royal Marquis Cir
- 2419 Liela Lee Ct
- 2753 Cullens Ct
- 1952 Edinborough Place
- 528 Canby Cir
- 510 Canby Cir
- 534 Canby Cir
- 500 Canby Cir
- 546 Canby Cir
- 539 Canby Cir
- 488 Canby Cir
- 558 Canby Cir
- 2601 Ashville St
- 2572 Ocoee Reserve Ct
- 2580 Ocoee Reserve Ct
- 2576 Ocoee Reserve Ct
- 2564 Ocoee Reserve Ct
- 2568 Ocoee Reserve Ct
- 472 Canby Cir
- 2560 Ocoee Reserve Ct
- 451 Canby Cir
- 2614 Lake St
- 8833 Old Silver Star Rd
- 574 Canby Cir
Your Personal Tour Guide
Ask me questions while you tour the home.