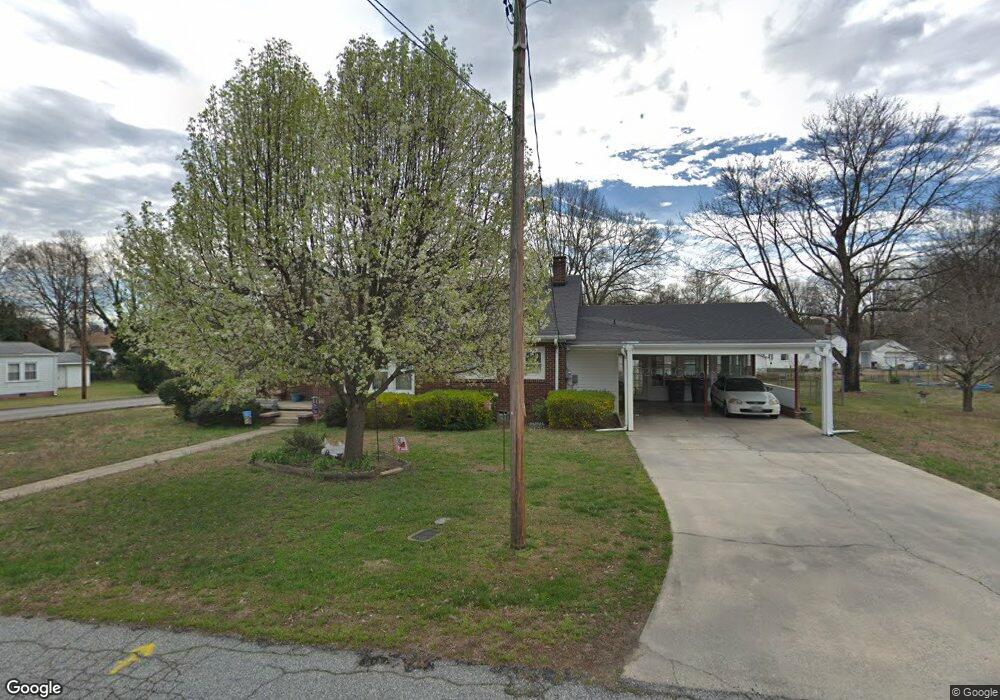
520 Charles St Kannapolis, NC 28083
Estimated Value: $326,000 - $355,000
3
Beds
2
Baths
1,604
Sq Ft
$213/Sq Ft
Est. Value
About This Home
This home is located at 520 Charles St, Kannapolis, NC 28083 and is currently estimated at $342,189, approximately $213 per square foot. 520 Charles St is a home located in Cabarrus County with nearby schools including Forest Park Elementary School, Kannapolis Middle, and A.L. Brown High School.
Ownership History
Date
Name
Owned For
Owner Type
Purchase Details
Closed on
May 7, 2025
Sold by
Kraft Janet Joy and Kraft Tyler James
Bought by
Miller Alexandria Elizabeth
Current Estimated Value
Home Financials for this Owner
Home Financials are based on the most recent Mortgage that was taken out on this home.
Original Mortgage
$348,570
Outstanding Balance
$347,336
Interest Rate
6.65%
Mortgage Type
New Conventional
Estimated Equity
-$5,147
Purchase Details
Closed on
Aug 16, 2024
Sold by
Roy Janyce W
Bought by
Roy Janyce W
Purchase Details
Closed on
Aug 1, 2024
Sold by
Kraft Janet Joy
Bought by
Kraft Janet Joy
Purchase Details
Closed on
Nov 6, 2020
Sold by
Roy Janice Winecoff
Bought by
Roy Garrett Jason and Roy James Audra
Create a Home Valuation Report for This Property
The Home Valuation Report is an in-depth analysis detailing your home's value as well as a comparison with similar homes in the area
Home Values in the Area
Average Home Value in this Area
Purchase History
| Date | Buyer | Sale Price | Title Company |
|---|---|---|---|
| Miller Alexandria Elizabeth | $355,000 | Integrated Title | |
| Miller Alexandria Elizabeth | $355,000 | Integrated Title | |
| Roy Janyce W | -- | None Listed On Document | |
| Kraft Janet Joy | -- | None Listed On Document | |
| Kraft Janet Joy | -- | None Listed On Document | |
| Roy Garrett Jason | -- | None Available |
Source: Public Records
Mortgage History
| Date | Status | Borrower | Loan Amount |
|---|---|---|---|
| Open | Miller Alexandria Elizabeth | $348,570 | |
| Closed | Miller Alexandria Elizabeth | $348,570 |
Source: Public Records
Tax History Compared to Growth
Tax History
| Year | Tax Paid | Tax Assessment Tax Assessment Total Assessment is a certain percentage of the fair market value that is determined by local assessors to be the total taxable value of land and additions on the property. | Land | Improvement |
|---|---|---|---|---|
| 2025 | $1,531 | $269,690 | $60,000 | $209,690 |
| 2024 | $3,062 | $269,690 | $60,000 | $209,690 |
| 2023 | $2,334 | $172,370 | $33,000 | $139,370 |
| 2022 | $2,334 | $164,780 | $33,000 | $131,780 |
| 2021 | $2,257 | $164,780 | $33,000 | $131,780 |
| 2020 | $2,257 | $164,780 | $33,000 | $131,780 |
| 2019 | $1,661 | $121,210 | $21,000 | $100,210 |
| 2018 | $1,636 | $121,210 | $21,000 | $100,210 |
| 2017 | $1,612 | $121,210 | $21,000 | $100,210 |
| 2016 | $1,612 | $112,430 | $22,500 | $89,930 |
| 2015 | $708 | $112,430 | $22,500 | $89,930 |
| 2014 | $708 | $112,430 | $22,500 | $89,930 |
Source: Public Records
Map
Nearby Homes
- 1008 Packard Ave
- 608 Fairview St
- 500 Plymouth St
- 615 Fairview St
- 613 Hillside St
- 617 Fairview St
- 506 Ford St
- 402 Ford St
- 505 Rogers Lake Rd E
- 803 Desoto Ave
- 803 Irene Ave
- 910 Fairview St
- 1004 S Ridge Ave
- 209 James St
- 417 York Ave
- 621 Norland Ave
- 704 Gem St Unit 17
- 1050 Mclain Rd
- 704 S Harding Ave
- 1052 Mclain Rd