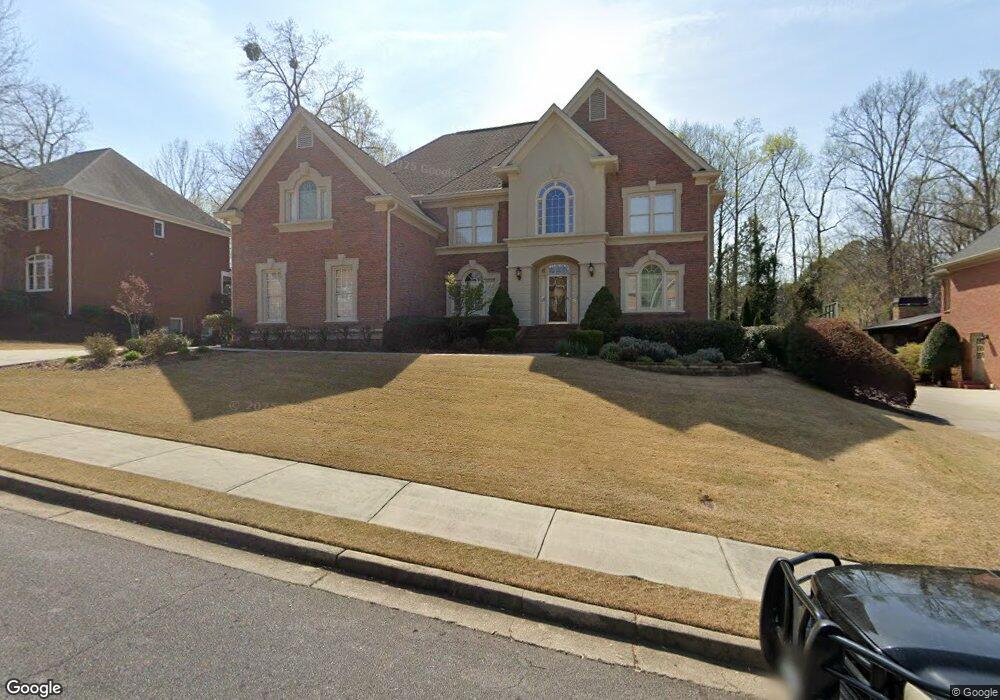
520 Clarinbridge Way Alpharetta, GA 30022
Estimated Value: $1,084,628 - $1,252,000
4
Beds
4
Baths
4,044
Sq Ft
$290/Sq Ft
Est. Value
About This Home
This home is located at 520 Clarinbridge Way, Alpharetta, GA 30022 and is currently estimated at $1,171,407, approximately $289 per square foot. 520 Clarinbridge Way is a home located in Fulton County with nearby schools including New Prospect Elementary School, Webb Bridge Middle School, and Alpharetta High School.
Ownership History
Date
Name
Owned For
Owner Type
Purchase Details
Closed on
Sep 10, 2004
Sold by
Juang Wei and Juang Lun
Bought by
Juang Wei and Juang Lun
Current Estimated Value
Home Financials for this Owner
Home Financials are based on the most recent Mortgage that was taken out on this home.
Original Mortgage
$333,700
Outstanding Balance
$148,576
Interest Rate
4.38%
Mortgage Type
New Conventional
Estimated Equity
$1,022,831
Purchase Details
Closed on
Nov 28, 1997
Sold by
Gcs Properties Inc
Bought by
Kim Chung H and Kim Susie
Home Financials for this Owner
Home Financials are based on the most recent Mortgage that was taken out on this home.
Original Mortgage
$214,600
Interest Rate
7.2%
Mortgage Type
New Conventional
Purchase Details
Closed on
Feb 21, 1997
Sold by
Jim Cowart Inc
Bought by
Gcs Props Inc
Create a Home Valuation Report for This Property
The Home Valuation Report is an in-depth analysis detailing your home's value as well as a comparison with similar homes in the area
Home Values in the Area
Average Home Value in this Area
Purchase History
| Date | Buyer | Sale Price | Title Company |
|---|---|---|---|
| Juang Wei | -- | -- | |
| Juang Wei | $555,000 | -- | |
| Kim Chung H | $373,000 | -- | |
| Gcs Props Inc | $75,600 | -- |
Source: Public Records
Mortgage History
| Date | Status | Borrower | Loan Amount |
|---|---|---|---|
| Open | Juang Wei | $333,700 | |
| Closed | Juang Wei | $165,000 | |
| Previous Owner | Kim Chung H | $214,600 |
Source: Public Records
Tax History Compared to Growth
Tax History
| Year | Tax Paid | Tax Assessment Tax Assessment Total Assessment is a certain percentage of the fair market value that is determined by local assessors to be the total taxable value of land and additions on the property. | Land | Improvement |
|---|---|---|---|---|
| 2025 | $1,407 | $358,840 | $68,760 | $290,080 |
| 2023 | $10,129 | $358,840 | $65,160 | $293,680 |
| 2022 | $6,515 | $293,440 | $47,880 | $245,560 |
| 2021 | $7,727 | $261,360 | $47,760 | $213,600 |
| 2020 | $7,792 | $269,280 | $36,400 | $232,880 |
| 2019 | $1,221 | $264,520 | $35,760 | $228,760 |
| 2018 | $6,775 | $258,320 | $34,920 | $223,400 |
| 2017 | $6,439 | $232,640 | $36,800 | $195,840 |
| 2016 | $6,439 | $232,640 | $36,800 | $195,840 |
| 2015 | $7,602 | $232,640 | $36,800 | $195,840 |
| 2014 | $6,241 | $216,360 | $34,200 | $182,160 |
Source: Public Records
Map
Nearby Homes
- 345 Kincardine Way Unit IIIA
- 465 Kirkstall Trail
- 10880 Windham Way
- 10845 Carrissa Trail
- 125 Sandridge Ct
- 105 Kimball Bridge Cove
- 3962 Erin Dr
- 610 Varina Way
- 870 Longstone Landing
- 3010 Brooke View Ct Unit 5
- 10900 Wittenridge Dr Unit I3
- 10900 Wittenridge Dr Unit H8
- 10900 Wittenridge Dr Unit L6
- 4255 Park Brooke Trace
- 10530 Tuxford Dr
- 825 Highland Bend Cove
- 4465 Hawthorn Cir
- 530 Clarinbridge Way
- 525 Clarinbridge Way Unit 1
- 510 Clarinbridge Way
- 535 Clarinbridge Way
- 515 Clarinbridge Way
- 540 Clarinbridge Way
- 545 Clarinbridge Way Unit 1
- 500 Clarinbridge Way
- 3710 Grey Abbey Dr Unit 1
- 3680 Grey Abbey Dr Unit 8/23/11
- 3680 Grey Abbey Dr
- 220 Amesdale Ct
- 230 Amesdale Ct
- 555 Clarinbridge Way
- 550 Clarinbridge Way Unit 1
- 240 Amesdale Ct
- 3720 Grey Abbey Dr
- 210 Amesdale Ct
- 3670 Grey Abbey Dr Unit 1
- 3695 Grey Abbey Dr