Estimated Value: $215,000 - $234,000
2
Beds
1
Bath
1,181
Sq Ft
$193/Sq Ft
Est. Value
About This Home
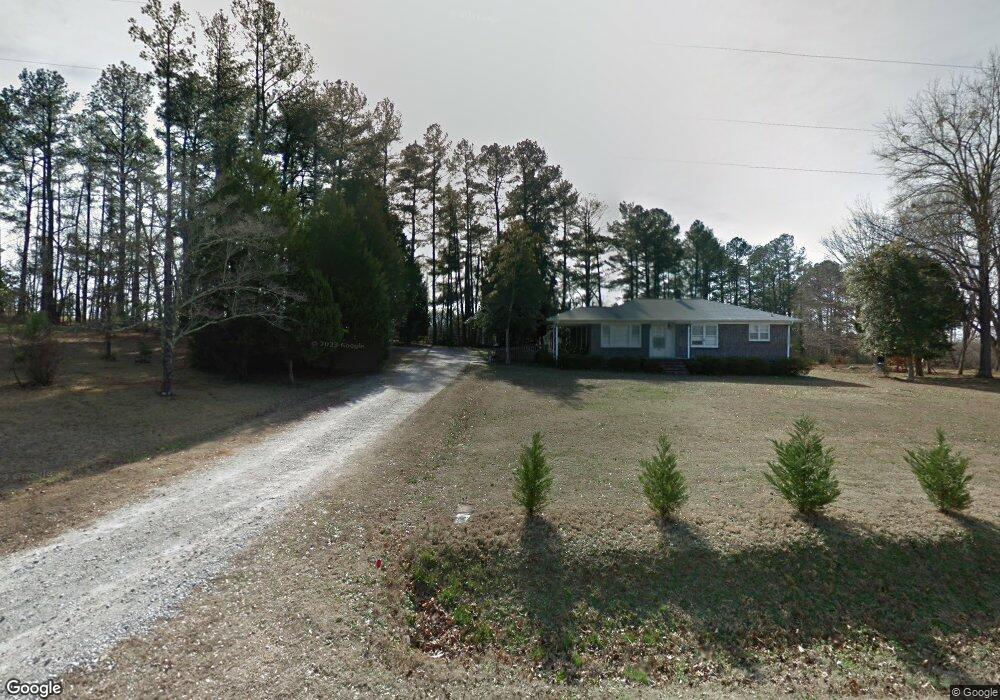
This home is located at 520 Clement Loop Rd, Inman, SC 29349 and is currently estimated at $228,354, approximately $193 per square foot. 520 Clement Loop Rd is a home located in Spartanburg County with nearby schools including Holly Springs-Motlow Elementary School, T.E. Mabry Middle School, and Chapman High School.
Ownership History
Date
Name
Owned For
Owner Type
Purchase Details
Closed on
Nov 27, 2018
Sold by
Becknell Rebecca J
Bought by
Skipper Darren
Current Estimated Value
Purchase Details
Closed on
May 24, 2010
Sold by
Jolley Nathan S and Jolley Laree S
Bought by
Skipper Darren and Becknell Rebecca J
Home Financials for this Owner
Home Financials are based on the most recent Mortgage that was taken out on this home.
Original Mortgage
$96,938
Interest Rate
5.03%
Mortgage Type
New Conventional
Purchase Details
Closed on
Aug 28, 2006
Sold by
Mayfield Louise G and Gilbert Ruby M
Bought by
Jolley Nathan S and Jolley Laree S
Home Financials for this Owner
Home Financials are based on the most recent Mortgage that was taken out on this home.
Original Mortgage
$21,250
Interest Rate
6.58%
Mortgage Type
Unknown
Purchase Details
Closed on
Dec 27, 2005
Sold by
Mayfield Louise G
Bought by
Gilbert Ruby M
Purchase Details
Closed on
Dec 6, 2005
Sold by
Thompson Susan M
Bought by
Mayfield Louise G
Create a Home Valuation Report for This Property
The Home Valuation Report is an in-depth analysis detailing your home's value as well as a comparison with similar homes in the area
Home Values in the Area
Average Home Value in this Area
Purchase History
| Date | Buyer | Sale Price | Title Company |
|---|---|---|---|
| Skipper Darren | -- | None Available | |
| Skipper Darren | $95,000 | -- | |
| Jolley Nathan S | $85,000 | None Available | |
| Gilbert Ruby M | -- | -- | |
| Mayfield Louise G | -- | -- |
Source: Public Records
Mortgage History
| Date | Status | Borrower | Loan Amount |
|---|---|---|---|
| Previous Owner | Skipper Darren | $96,938 | |
| Previous Owner | Jolley Nathan S | $21,250 | |
| Previous Owner | Jolley Nathan S | $637,500 |
Source: Public Records
Tax History
| Year | Tax Paid | Tax Assessment Tax Assessment Total Assessment is a certain percentage of the fair market value that is determined by local assessors to be the total taxable value of land and additions on the property. | Land | Improvement |
|---|---|---|---|---|
| 2022 | $910 | $4,476 | $780 | $3,696 |
| 2021 | $901 | $4,476 | $780 | $3,696 |
| 2020 | $882 | $4,476 | $780 | $3,696 |
| 2019 | $2,865 | $4,476 | $780 | $3,696 |
| 2018 | $871 | $4,476 | $780 | $3,696 |
| 2017 | $766 | $3,972 | $752 | $3,220 |
| 2016 | $759 | $3,972 | $752 | $3,220 |
| 2015 | $743 | $3,972 | $752 | $3,220 |
| 2014 | $736 | $3,972 | $752 | $3,220 |
Source: Public Records
Map
Nearby Homes
- 1007 Messer Farm Ln
- 1004 Messer Farm Ln
- 242 Artisan Dr
- 246 Artisan Dr
- 250 Artisan Dr
- 254 Artisan Dr
- 239 Artisan Dr
- 235 Artisan Dr
- 219 Artisan Dr
- 211 Artisan Dr
- 354 Lyman Lake Rd
- 350 Lyman Lake Rd
- 294 Lyman Lake Rd
- 98 Lyman Lake Rd
- 26 Lyman Lake Rd
- 227 Lyman Lake Rd
- 221 Lyman Lake Rd
- 230 Lake Lyman Heights
- 210 Amy St
- 611 W Star Dr
- 560 Clement Loop Rd
- 551 Clement Loop Rd
- 500 Clement Loop Rd
- 491 Clement Loop Rd
- 480 Clement Loop Rd
- 281 Mountain View Ln
- 474 Clement Loop Rd
- 390 Rector Rd
- 561 Clement Loop Rd
- 371 Rector Rd
- 390 Rector Lot # 4 Rd
- 291 Mountain View Ln
- 381 Rector Rd
- 361 Rector Rd
- 0 Mountain View Ln
- 450 Clement Loop Rd
- 331 Rector Rd
- 305 Mountain View Ln
- 368 Rector Rd
- 364 Rector Rd
Your Personal Tour Guide
Ask me questions while you tour the home.