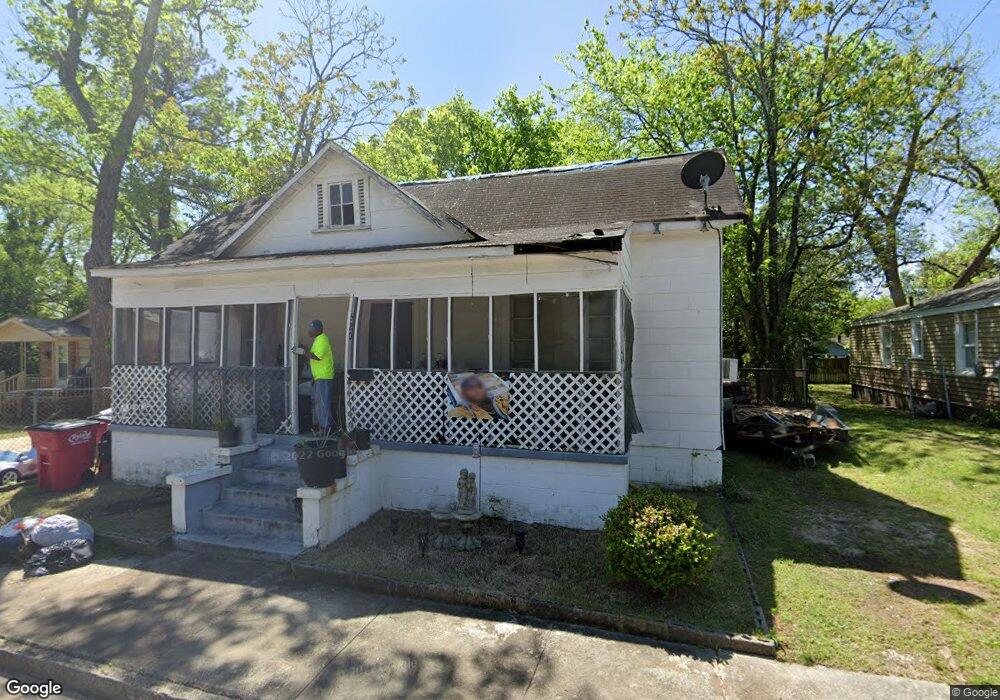
520 Crisp St Macon, GA 31206
Estimated Value: $35,000 - $56,000
2
Beds
1
Bath
1,152
Sq Ft
$39/Sq Ft
Est. Value
About This Home
This home is located at 520 Crisp St, Macon, GA 31206 and is currently estimated at $44,608, approximately $38 per square foot. 520 Crisp St is a home located in Bibb County with nearby schools including Ingram-Pye Elementary School, Central High School, and Cirrus Charter Academy.
Ownership History
Date
Name
Owned For
Owner Type
Purchase Details
Closed on
Nov 2, 2009
Sold by
Adside Wallace
Bought by
Durham Edward C
Current Estimated Value
Home Financials for this Owner
Home Financials are based on the most recent Mortgage that was taken out on this home.
Original Mortgage
$7,750
Interest Rate
5.02%
Mortgage Type
Seller Take Back
Purchase Details
Closed on
Mar 27, 2009
Sold by
Countrywide Home Loans Inc
Bought by
Adside Wallace
Purchase Details
Closed on
Feb 28, 2009
Sold by
Zimmerle Isaac
Bought by
Smith Carman
Purchase Details
Closed on
Apr 1, 2008
Sold by
Smith Carman and Smith Eric
Bought by
Zimmerle Isaac
Purchase Details
Closed on
Feb 6, 2008
Sold by
Zimmerle Isaac
Bought by
Countrywide Home Loans Inc
Purchase Details
Closed on
Dec 12, 2003
Bought by
Smith Carman and Smith Eric
Create a Home Valuation Report for This Property
The Home Valuation Report is an in-depth analysis detailing your home's value as well as a comparison with similar homes in the area
Purchase History
| Date | Buyer | Sale Price | Title Company |
|---|---|---|---|
| Durham Edward C | $8,000 | None Available | |
| Adside Wallace | $4,000 | None Available | |
| Smith Carman | $2,974 | None Available | |
| Zimmerle Isaac | $2,000 | None Available | |
| Countrywide Home Loans Inc | $48,300 | -- | |
| Countrywide Home Loans Inc | $48,309 | None Available | |
| Smith Carman | $50,000 | -- |
Source: Public Records
Mortgage History
| Date | Status | Borrower | Loan Amount |
|---|---|---|---|
| Previous Owner | Durham Edward C | $7,750 |
Source: Public Records
Tax History
| Year | Tax Paid | Tax Assessment Tax Assessment Total Assessment is a certain percentage of the fair market value that is determined by local assessors to be the total taxable value of land and additions on the property. | Land | Improvement |
|---|---|---|---|---|
| 2025 | $312 | $12,676 | $1,440 | $11,236 |
| 2024 | $322 | $12,676 | $1,440 | $11,236 |
| 2023 | $317 | $10,706 | $960 | $9,746 |
| 2022 | $259 | $7,474 | $1,517 | $5,957 |
| 2021 | $189 | $4,986 | $731 | $4,255 |
| 2020 | $194 | $4,986 | $731 | $4,255 |
| 2019 | $178 | $4,556 | $688 | $3,868 |
| 2018 | $453 | $4,556 | $688 | $3,868 |
| 2017 | $171 | $4,556 | $688 | $3,868 |
| 2016 | $158 | $4,556 | $688 | $3,868 |
| 2015 | $261 | $5,330 | $688 | $4,642 |
| 2014 | $300 | $5,330 | $688 | $4,642 |
Source: Public Records
Map
Nearby Homes
- 532 Nelson St
- 554 Nelson St
- 579 Charles St
- 2752 Antioch Rd
- 548 Colquitt St
- 534 Hanson St
- 537 Colquitt St
- 538 Cleveland St
- 2890 Bacon St
- 2884 Antioch Rd
- 678 Dixie Ave
- 2573 Peacock St
- 537 Rutherford Ave
- 648 Hightower Rd
- 579 Rutherford Ave
- 622 Cleveland St
- 2920 Houston Ave
- 358 Pittman St
- 2641 Florence Ave S
- 2426 2nd St