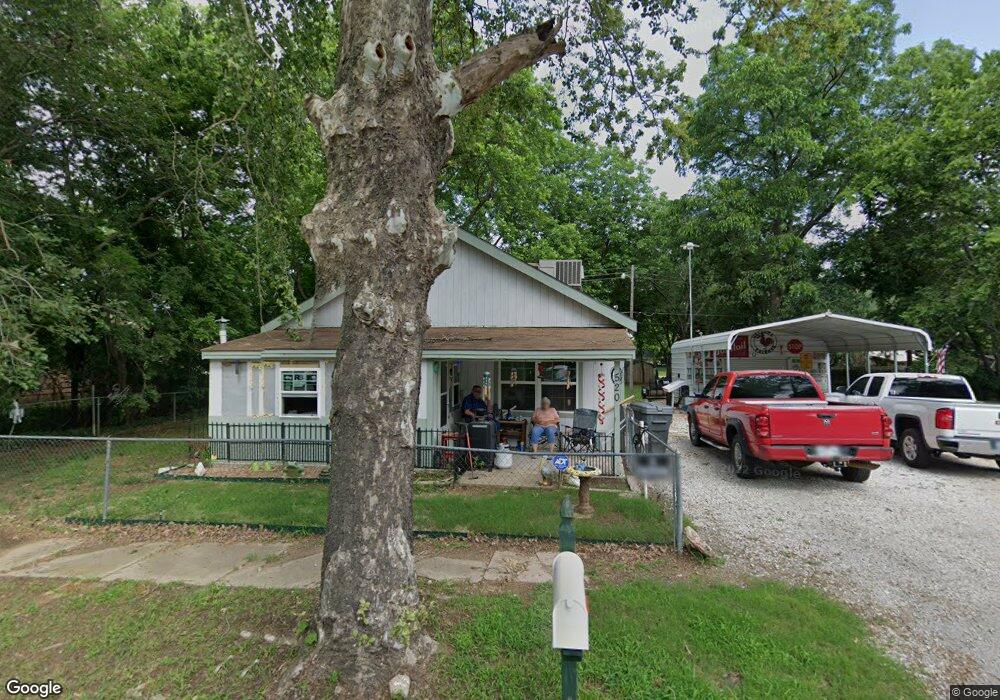
520 D St SE Ardmore, OK 73401
Estimated Value: $78,000 - $112,000
3
Beds
1
Bath
1,104
Sq Ft
$86/Sq Ft
Est. Value
About This Home
This home is located at 520 D St SE, Ardmore, OK 73401 and is currently estimated at $94,982, approximately $86 per square foot. 520 D St SE is a home located in Carter County with nearby schools including Jefferson Elementary School, Ardmore Middle School, and Ardmore High School.
Ownership History
Date
Name
Owned For
Owner Type
Purchase Details
Closed on
May 14, 2018
Sold by
Demars Terry
Bought by
Faulkinbury George
Current Estimated Value
Home Financials for this Owner
Home Financials are based on the most recent Mortgage that was taken out on this home.
Original Mortgage
$50,000
Outstanding Balance
$36,497
Interest Rate
4.4%
Mortgage Type
New Conventional
Estimated Equity
$58,485
Purchase Details
Closed on
Aug 16, 1996
Sold by
Smith Gary K
Bought by
Demars Cathy and Demars Terry
Create a Home Valuation Report for This Property
The Home Valuation Report is an in-depth analysis detailing your home's value as well as a comparison with similar homes in the area
Home Values in the Area
Average Home Value in this Area
Purchase History
| Date | Buyer | Sale Price | Title Company |
|---|---|---|---|
| Faulkinbury George | -- | Stewart Title Of Oklahoma In | |
| Demars Cathy | $6,000 | -- |
Source: Public Records
Mortgage History
| Date | Status | Borrower | Loan Amount |
|---|---|---|---|
| Open | Faulkinbury George | $50,000 |
Source: Public Records
Tax History Compared to Growth
Tax History
| Year | Tax Paid | Tax Assessment Tax Assessment Total Assessment is a certain percentage of the fair market value that is determined by local assessors to be the total taxable value of land and additions on the property. | Land | Improvement |
|---|---|---|---|---|
| 2024 | $229 | $3,193 | $632 | $2,561 |
| 2023 | $219 | $3,100 | $625 | $2,475 |
| 2022 | $192 | $3,010 | $618 | $2,392 |
| 2021 | $194 | $2,922 | $607 | $2,315 |
| 2020 | $183 | $2,837 | $595 | $2,242 |
| 2019 | $170 | $2,755 | $595 | $2,160 |
| 2018 | $165 | $2,675 | $595 | $2,080 |
| 2017 | $146 | $2,596 | $595 | $2,001 |
| 2016 | $142 | $2,521 | $595 | $1,926 |
| 2015 | $111 | $2,447 | $595 | $1,852 |
| 2014 | $123 | $2,376 | $595 | $1,781 |
Source: Public Records
Map
Nearby Homes
- 511 7th Ave SE
- 513 Lake Murray Dr E
- 603 6th Ave SE
- 808 Carter St SE
- 403 Carter St SE
- 310 4th Ave SE
- 417 E St SE
- 400 Carter St SE
- 426 E St SE
- 812 C St SE
- 616 8th Ave SE
- 525 Lake Murray Dr S
- 837 C St SE
- 301 Carter St SE
- 210 9th Ave SE
- 218 D St SE
- 901 A St SE
- 825 4th Ave SE
- 1024 C St SW
- 1000 Hugo St SE