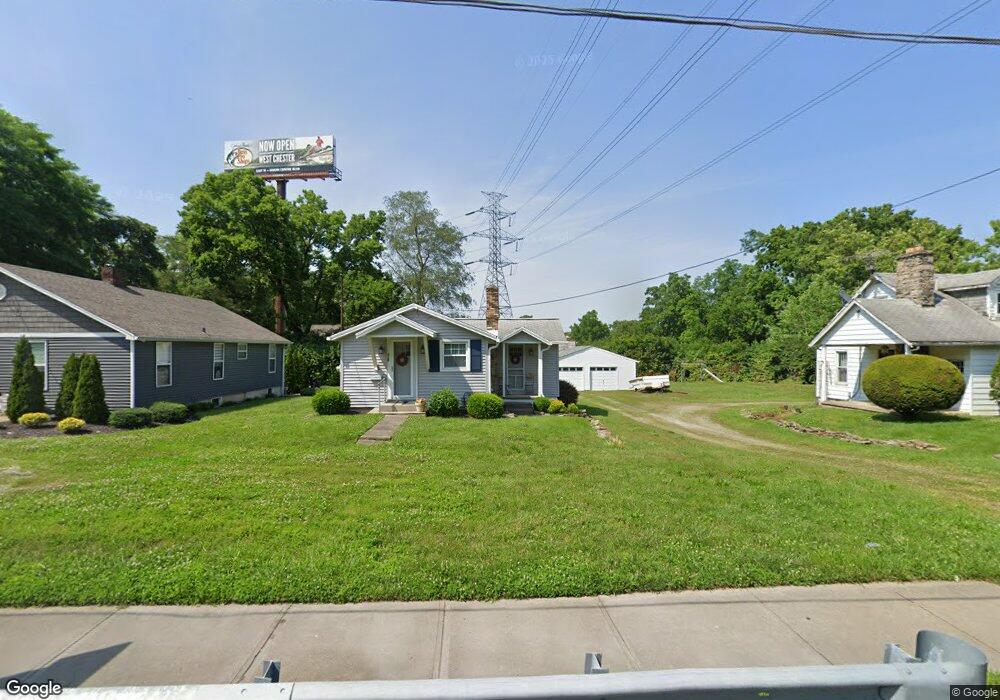
520 Davis St Cincinnati, OH 45215
Estimated Value: $182,000 - $218,000
3
Beds
1
Bath
1,771
Sq Ft
$109/Sq Ft
Est. Value
About This Home
This home is located at 520 Davis St, Cincinnati, OH 45215 and is currently estimated at $192,414, approximately $108 per square foot. 520 Davis St is a home located in Hamilton County with nearby schools including Lockland Elementary School, Lockland Middle School, and Lockland High School.
Ownership History
Date
Name
Owned For
Owner Type
Purchase Details
Closed on
Nov 27, 2019
Sold by
Foley Susan A
Bought by
Trj Realty Llc
Current Estimated Value
Home Financials for this Owner
Home Financials are based on the most recent Mortgage that was taken out on this home.
Original Mortgage
$212,500
Outstanding Balance
$92,424
Interest Rate
3.6%
Mortgage Type
Future Advance Clause Open End Mortgage
Estimated Equity
$99,990
Purchase Details
Closed on
Nov 16, 2019
Sold by
Foley Susan A
Bought by
Foley Susan A
Home Financials for this Owner
Home Financials are based on the most recent Mortgage that was taken out on this home.
Original Mortgage
$212,500
Outstanding Balance
$92,424
Interest Rate
3.6%
Mortgage Type
Future Advance Clause Open End Mortgage
Estimated Equity
$99,990
Purchase Details
Closed on
Apr 26, 2010
Sold by
Foley Daniel E and Foley Susan A
Bought by
Foley Daniel E and Foley Susan A
Create a Home Valuation Report for This Property
The Home Valuation Report is an in-depth analysis detailing your home's value as well as a comparison with similar homes in the area
Home Values in the Area
Average Home Value in this Area
Purchase History
| Date | Buyer | Sale Price | Title Company |
|---|---|---|---|
| Trj Realty Llc | $250,001 | None Available | |
| Foley Susan A | -- | None Available | |
| Foley Daniel E | -- | Attorney |
Source: Public Records
Mortgage History
| Date | Status | Borrower | Loan Amount |
|---|---|---|---|
| Open | Trj Realty Llc | $212,500 |
Source: Public Records
Tax History
| Year | Tax Paid | Tax Assessment Tax Assessment Total Assessment is a certain percentage of the fair market value that is determined by local assessors to be the total taxable value of land and additions on the property. | Land | Improvement |
|---|---|---|---|---|
| 2025 | $2,018 | $35,729 | $6,283 | $29,446 |
| 2024 | $2,057 | $35,729 | $6,283 | $29,446 |
| 2023 | $2,038 | $35,729 | $6,283 | $29,446 |
| 2022 | $2,507 | $35,340 | $5,492 | $29,848 |
| 2021 | $2,538 | $35,340 | $5,492 | $29,848 |
| 2020 | $2,174 | $35,340 | $5,492 | $29,848 |
| 2019 | $1,608 | $33,835 | $5,408 | $28,427 |
| 2018 | $1,583 | $33,835 | $5,408 | $28,427 |
| 2017 | $1,484 | $33,835 | $5,408 | $28,427 |
| 2016 | $1,390 | $32,649 | $5,527 | $27,122 |
| 2015 | $1,331 | $32,649 | $5,527 | $27,122 |
| 2014 | $1,330 | $32,649 | $5,527 | $27,122 |
| 2013 | $1,449 | $35,487 | $6,006 | $29,481 |
Source: Public Records
Map
Nearby Homes
- 321 Southern Ave
- 311 Southern Ave
- 415 Arlington Ave
- 129 Pike St
- 435 Pearl St
- 306 Pearl St
- 654 3rd St
- 329 Walnut St
- 20 Clark Rd
- 1401 Jefferson Ave
- 1421 Jefferson Ave
- 0 Hill St Unit 1616370
- 310 E Vine St
- 217 W Wyoming Ave
- 529 Elliott Ave
- 1521 Hunt Rd
- 2281 E Galbraith Rd
- 454 Hillside Ave
- 68 Gorman Ln
- 59 Gorman Ln
Your Personal Tour Guide
Ask me questions while you tour the home.