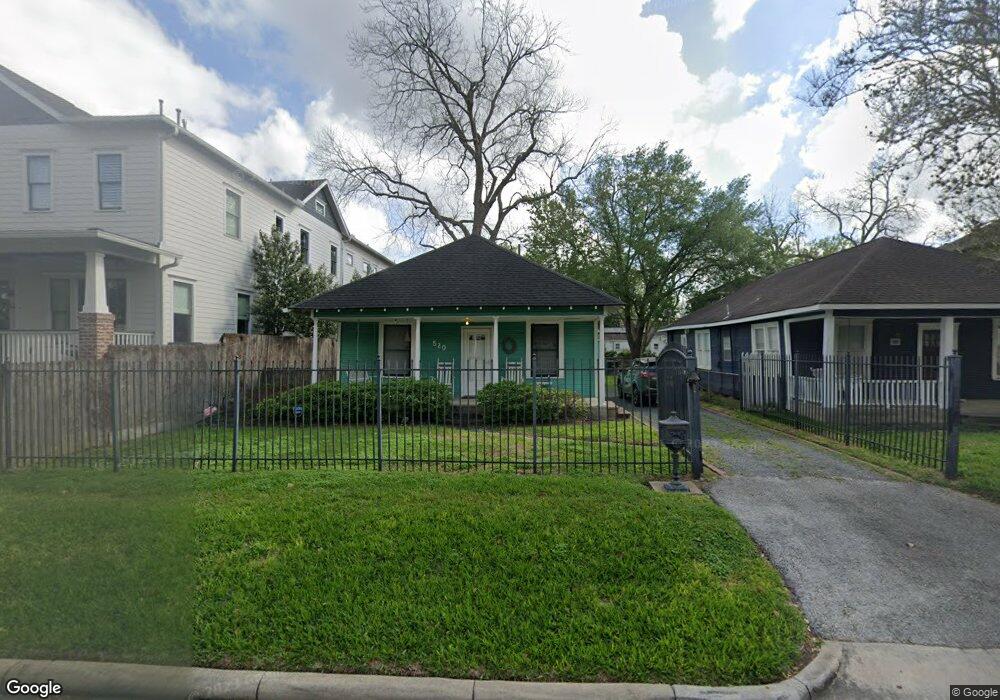
520 E 24th St Houston, TX 77008
Greater Heights NeighborhoodEstimated Value: $527,000 - $574,744
3
Beds
1
Bath
936
Sq Ft
$587/Sq Ft
Est. Value
About This Home
This home is located at 520 E 24th St, Houston, TX 77008 and is currently estimated at $549,436, approximately $587 per square foot. 520 E 24th St is a home located in Harris County with nearby schools including Field Elementary School, Hamilton Middle, and Heights High School.
Ownership History
Date
Name
Owned For
Owner Type
Purchase Details
Closed on
Dec 10, 2024
Sold by
Heiney Steven Eaker and Heiney Andrew Steven
Bought by
Heiney Andrew Steven
Current Estimated Value
Purchase Details
Closed on
Mar 25, 1999
Sold by
Hometown Concepts Inc
Bought by
Weiler Michael and Weiler Kim
Home Financials for this Owner
Home Financials are based on the most recent Mortgage that was taken out on this home.
Original Mortgage
$97,200
Interest Rate
6.69%
Create a Home Valuation Report for This Property
The Home Valuation Report is an in-depth analysis detailing your home's value as well as a comparison with similar homes in the area
Home Values in the Area
Average Home Value in this Area
Purchase History
| Date | Buyer | Sale Price | Title Company |
|---|---|---|---|
| Heiney Andrew Steven | -- | None Listed On Document | |
| Weiler Michael | -- | Texas American Title Company |
Source: Public Records
Mortgage History
| Date | Status | Borrower | Loan Amount |
|---|---|---|---|
| Previous Owner | Weiler Michael | $97,200 |
Source: Public Records
Tax History Compared to Growth
Tax History
| Year | Tax Paid | Tax Assessment Tax Assessment Total Assessment is a certain percentage of the fair market value that is determined by local assessors to be the total taxable value of land and additions on the property. | Land | Improvement |
|---|---|---|---|---|
| 2025 | $1,723 | $554,267 | $510,000 | $44,267 |
| 2024 | $1,723 | $500,253 | $450,000 | $50,253 |
| 2023 | $1,723 | $471,021 | $420,000 | $51,021 |
| 2022 | $8,624 | $391,663 | $348,000 | $43,663 |
| 2021 | $8,580 | $368,118 | $330,000 | $38,118 |
| 2020 | $8,163 | $365,245 | $330,000 | $35,245 |
| 2019 | $7,755 | $362,688 | $330,000 | $32,688 |
| 2018 | $2,863 | $341,594 | $312,000 | $29,594 |
| 2017 | $6,404 | $341,594 | $312,000 | $29,594 |
| 2016 | $5,822 | $341,594 | $312,000 | $29,594 |
| 2015 | $3,754 | $299,594 | $270,000 | $29,594 |
| 2014 | $3,754 | $244,025 | $216,000 | $28,025 |
Source: Public Records
Map
Nearby Homes
- 424 E 24th St
- 602 E 24th St
- 2415 Columbia St
- 508 E 25th St
- 2222 Oxford St
- 608 E 26th St
- 2124 Gostick St
- 501 E 26th St
- 211 E 24th St
- 2206 Singleton St
- 203 E 24th St
- 208 Aurora St Unit B
- 818 E 24th St
- 404 E 28th St
- 117 E 25th St
- 1846 Arlington St
- 200 E 26th St
- 222 E 27th St
- 844 E 25th St
- 2014 Sheldon St