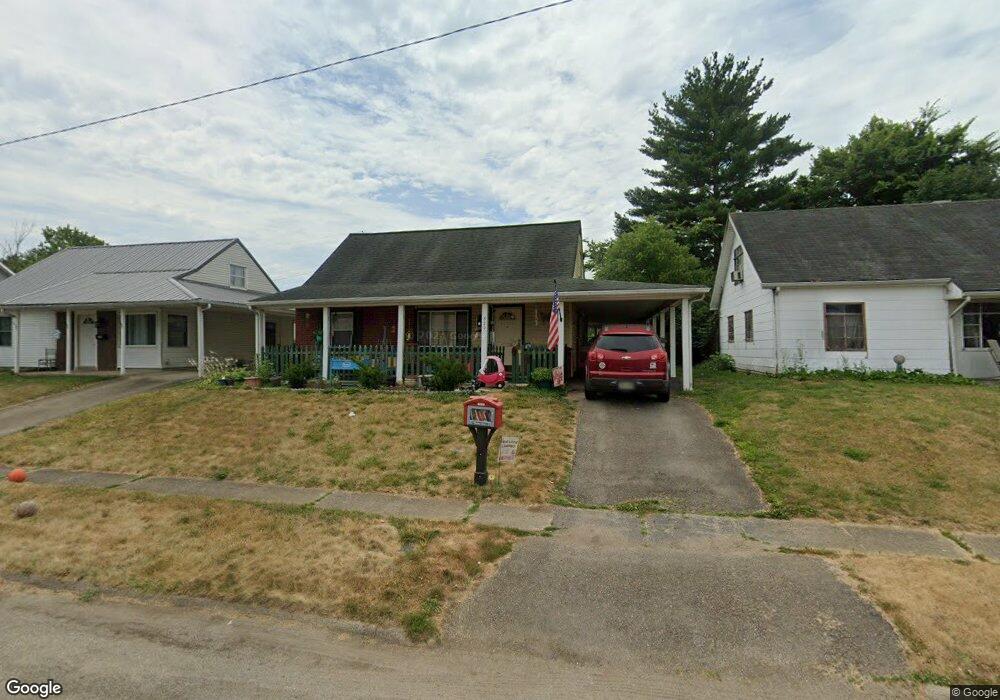
520 E 3rd St Waverly, OH 45690
Estimated Value: $163,000 - $244,000
3
Beds
2
Baths
2,040
Sq Ft
$94/Sq Ft
Est. Value
About This Home
This home is located at 520 E 3rd St, Waverly, OH 45690 and is currently estimated at $191,475, approximately $93 per square foot. 520 E 3rd St is a home located in Pike County with nearby schools including Waverly Primary School, Waverly Intermediate School, and Waverly Junior High School.
Ownership History
Date
Name
Owned For
Owner Type
Purchase Details
Closed on
May 7, 2018
Sold by
Manning Dean
Bought by
Perkins Richard and Perkins Patricia
Current Estimated Value
Home Financials for this Owner
Home Financials are based on the most recent Mortgage that was taken out on this home.
Original Mortgage
$87,878
Outstanding Balance
$75,736
Interest Rate
4.44%
Mortgage Type
New Conventional
Estimated Equity
$115,739
Purchase Details
Closed on
Apr 5, 2018
Sold by
Estate Of Sonja Anne Stegmann
Bought by
Manning Dean
Home Financials for this Owner
Home Financials are based on the most recent Mortgage that was taken out on this home.
Original Mortgage
$87,878
Outstanding Balance
$75,736
Interest Rate
4.44%
Mortgage Type
New Conventional
Estimated Equity
$115,739
Purchase Details
Closed on
May 1, 2017
Sold by
Manning Manning J and Manning Dean
Bought by
Manning Manning J and Manning Marsha N
Purchase Details
Closed on
Jul 26, 2007
Sold by
Stegmann Sonja A
Bought by
Stegmann Sonja S
Create a Home Valuation Report for This Property
The Home Valuation Report is an in-depth analysis detailing your home's value as well as a comparison with similar homes in the area
Home Values in the Area
Average Home Value in this Area
Purchase History
| Date | Buyer | Sale Price | Title Company |
|---|---|---|---|
| Perkins Richard | $87,000 | None Available | |
| Manning Dean | -- | None Available | |
| Manning Manning J | -- | None Available | |
| Stegmann Sonja S | -- | Imperial Title Services Llc |
Source: Public Records
Mortgage History
| Date | Status | Borrower | Loan Amount |
|---|---|---|---|
| Open | Perkins Richard | $87,878 |
Source: Public Records
Tax History
| Year | Tax Paid | Tax Assessment Tax Assessment Total Assessment is a certain percentage of the fair market value that is determined by local assessors to be the total taxable value of land and additions on the property. | Land | Improvement |
|---|---|---|---|---|
| 2024 | $1,662 | $45,160 | $6,930 | $38,230 |
| 2023 | $1,598 | $45,160 | $6,930 | $38,230 |
| 2022 | $1,255 | $30,830 | $5,350 | $25,480 |
| 2021 | $1,231 | $30,830 | $5,350 | $25,480 |
| 2020 | $1,232 | $30,830 | $5,350 | $25,480 |
| 2019 | $1,053 | $26,130 | $4,540 | $21,590 |
| 2018 | $844 | $26,130 | $4,540 | $21,590 |
| 2017 | $1,038 | $26,130 | $4,540 | $21,590 |
| 2016 | $631 | $24,050 | $3,870 | $20,180 |
| 2015 | $631 | $24,050 | $3,870 | $20,180 |
| 2014 | $611 | $24,050 | $3,870 | $20,180 |
| 2013 | $619 | $24,050 | $3,870 | $20,180 |
| 2012 | $634 | $24,050 | $3,870 | $20,180 |
Source: Public Records
Map
Nearby Homes
Your Personal Tour Guide
Ask me questions while you tour the home.