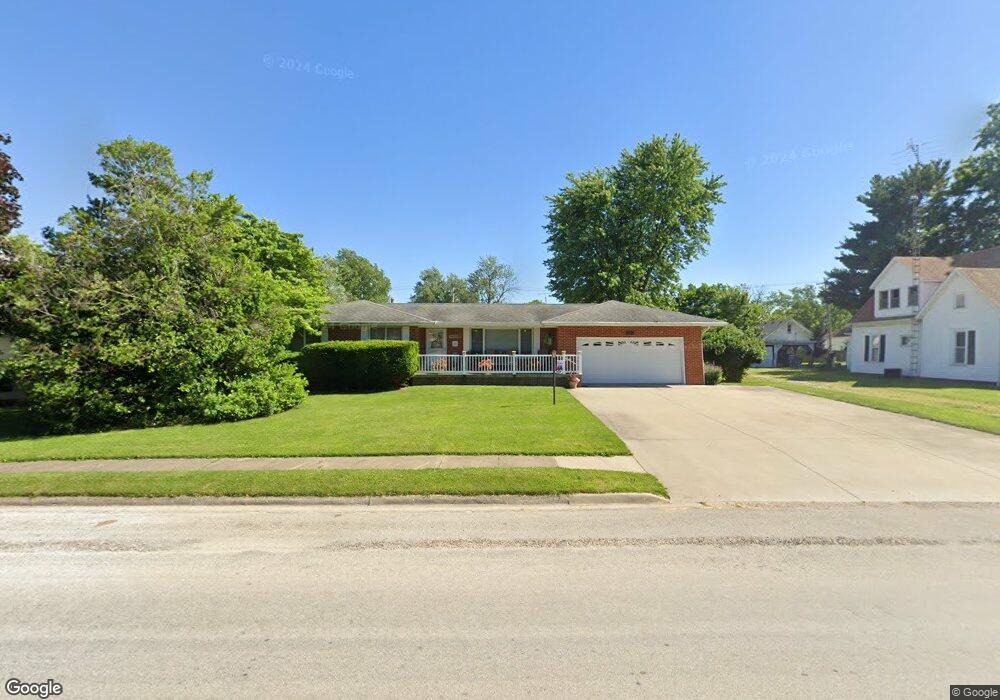
520 E Union St Nokomis, IL 62075
Estimated Value: $105,919 - $131,000
--
Bed
--
Bath
1,120
Sq Ft
$106/Sq Ft
Est. Value
About This Home
This home is located at 520 E Union St, Nokomis, IL 62075 and is currently estimated at $118,980, approximately $106 per square foot. 520 E Union St is a home located in Montgomery County with nearby schools including North Elementary School, Nokomis Junior/Senior High School, and St. Louis Catholic School.
Ownership History
Date
Name
Owned For
Owner Type
Purchase Details
Closed on
Oct 7, 2010
Sold by
Miller James A
Bought by
Miller James A and Slightom Diane L
Current Estimated Value
Purchase Details
Closed on
Jun 23, 2010
Sold by
Vickers Nancy G and Slightom Diane L
Bought by
Miller James A
Home Financials for this Owner
Home Financials are based on the most recent Mortgage that was taken out on this home.
Original Mortgage
$56,000
Interest Rate
4.86%
Mortgage Type
New Conventional
Create a Home Valuation Report for This Property
The Home Valuation Report is an in-depth analysis detailing your home's value as well as a comparison with similar homes in the area
Home Values in the Area
Average Home Value in this Area
Purchase History
| Date | Buyer | Sale Price | Title Company |
|---|---|---|---|
| Miller James A | -- | None Available | |
| Miller James A | $70,000 | None Available |
Source: Public Records
Mortgage History
| Date | Status | Borrower | Loan Amount |
|---|---|---|---|
| Closed | Miller James A | $56,000 |
Source: Public Records
Tax History Compared to Growth
Tax History
| Year | Tax Paid | Tax Assessment Tax Assessment Total Assessment is a certain percentage of the fair market value that is determined by local assessors to be the total taxable value of land and additions on the property. | Land | Improvement |
|---|---|---|---|---|
| 2024 | $2,169 | $30,940 | $4,240 | $26,700 |
| 2023 | $2,023 | $29,020 | $3,980 | $25,040 |
| 2022 | $1,963 | $27,880 | $3,820 | $24,060 |
| 2021 | $2,044 | $29,120 | $3,990 | $25,130 |
| 2020 | $1,939 | $27,780 | $3,810 | $23,970 |
| 2019 | $2,063 | $29,330 | $4,020 | $25,310 |
| 2018 | $1,973 | $27,610 | $3,780 | $23,830 |
| 2017 | $1,881 | $25,950 | $3,550 | $22,400 |
| 2016 | $1,876 | $25,240 | $3,450 | $21,790 |
| 2015 | $1,828 | $24,450 | $3,340 | $21,110 |
| 2013 | $1,770 | $24,750 | $3,380 | $21,370 |
Source: Public Records
Map
Nearby Homes