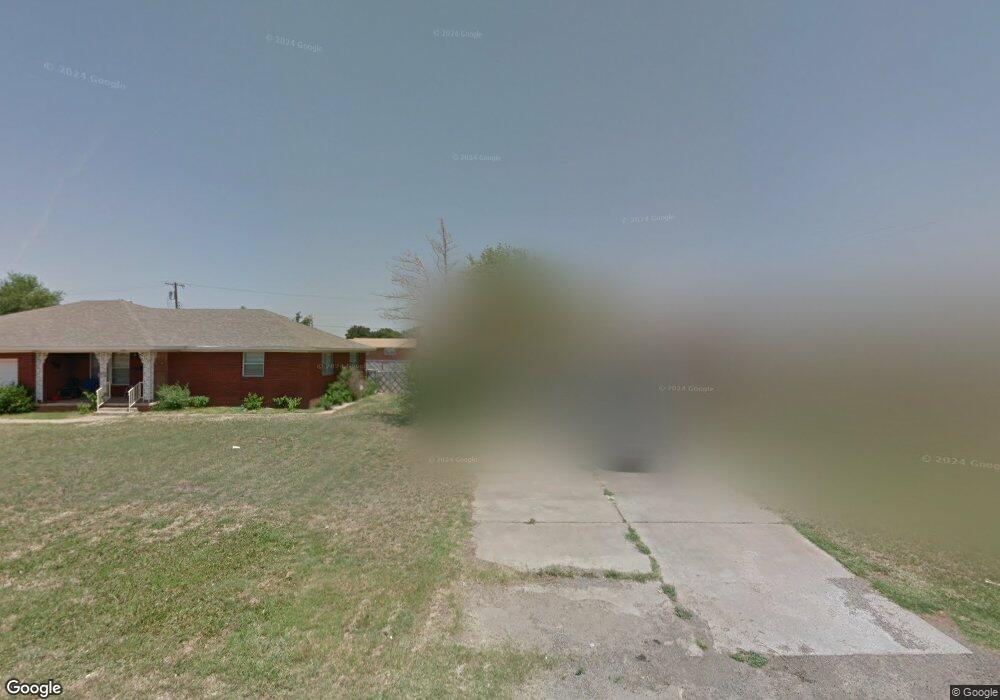
520 E Walnut St Hollis, OK 73550
Estimated Value: $88,000 - $272,000
Studio
--
Bath
1,962
Sq Ft
$90/Sq Ft
Est. Value
About This Home
This home is located at 520 E Walnut St, Hollis, OK 73550 and is currently estimated at $175,772, approximately $89 per square foot. 520 E Walnut St is a home located in Harmon County with nearby schools including Hollis Elementary School, Hollis Middle School, and Hollis High School.
Ownership History
Date
Name
Owned For
Owner Type
Purchase Details
Closed on
Oct 5, 2022
Sold by
Cattlemens Bank
Bought by
Rippetoe Rodney Ryan and Rippetoe Karlie Chantell
Current Estimated Value
Purchase Details
Closed on
Sep 23, 2020
Sold by
Kyle Melanie and Kyle Derrick
Bought by
Rippetoe Karli
Purchase Details
Closed on
Apr 5, 2018
Sold by
Bynum Douglas Ray and Bynum Tammy Kaye
Bought by
Rippetoe Rodney Ryan and Rippetoe Karli Chantell
Home Financials for this Owner
Home Financials are based on the most recent Mortgage that was taken out on this home.
Original Mortgage
$34,231
Interest Rate
4.4%
Mortgage Type
Purchase Money Mortgage
Purchase Details
Closed on
Jul 28, 2014
Sold by
Miranda Carolyn Manney E
Bought by
Rippetoe Ryan
Purchase Details
Closed on
Feb 20, 1997
Sold by
Bill Dill
Bought by
Wilmer Manney
Purchase Details
Closed on
Jan 9, 1997
Sold by
Willie Kuykendall
Bought by
Bill Dill
Purchase Details
Closed on
Nov 17, 1983
Bought by
Willie Kuykendall
Create a Home Valuation Report for This Property
The Home Valuation Report is an in-depth analysis detailing your home's value as well as a comparison with similar homes in the area
Purchase History
| Date | Buyer | Sale Price | Title Company |
|---|---|---|---|
| Rippetoe Rodney Ryan | -- | None Listed On Document | |
| Rippetoe Karli | $15,000 | None Available | |
| Rippetoe Rodney Ryan | $42,000 | None Available | |
| Rippetoe Ryan | $50,000 | -- | |
| Wilmer Manney | $63,500 | -- | |
| Bill Dill | $55,000 | -- | |
| Willie Kuykendall | -- | -- |
Source: Public Records
Mortgage History
| Date | Status | Borrower | Loan Amount |
|---|---|---|---|
| Previous Owner | Rippetoe Rodney Ryan | $34,231 |
Source: Public Records
Tax History
| Year | Tax Paid | Tax Assessment Tax Assessment Total Assessment is a certain percentage of the fair market value that is determined by local assessors to be the total taxable value of land and additions on the property. | Land | Improvement |
|---|---|---|---|---|
| 2025 | $736 | $7,418 | $588 | $6,830 |
| 2024 | $703 | $7,065 | $588 | $6,477 |
| 2023 | $703 | $7,065 | $588 | $6,477 |
| 2022 | $706 | $7,065 | $588 | $6,477 |
| 2021 | $710 | $7,065 | $588 | $6,477 |
| 2020 | $665 | $6,633 | $588 | $6,045 |
| 2019 | $641 | $6,317 | $588 | $5,729 |
| 2018 | $638 | $6,281 | $420 | $5,861 |
| 2017 | $625 | $6,284 | $420 | $5,864 |
| 2016 | $434 | $6,075 | $420 | $5,655 |
| 2015 | $400 | $6,025 | $420 | $5,605 |
| 2014 | $456 | $6,858 | $420 | $6,438 |
Source: Public Records
Map
Nearby Homes
- 1223 N 6th St
- 601 N Morton St
- 301 E Versa St
- 214 W Dorothy St
- 16633 E 1530 Rd
- Trolinder Rd Fm 680
- TBD E 1680 Rd
- 16820 Co Rd L
- E 1630 Rd
- 000 County Road A
- 17736 County Road 1480 Rd
- N 1850 Rd
- 16820 County Road L
- N176 E147-Tract4
- North Tract N 1850 Rd
- South Tract E 1630 Rd
- 0 Quail Haven Unit 25-9856
- N176 E145
- 0 N1762 Rd
- 65 N1870 Rd
- 522 E Walnut St
- 510 E Walnut St
- 519 E Locust St
- 521 E Locust St
- 523 E Locust St
- 1101 N 7th St
- 1125 N 7th St
- 1025 N 7th St
- 1125 N 8th St
- 1215 N 7th St
- 1204 N 7th St
- 1211 N 6th St
- 1224 N 7th St
- 423 E Chestnut St
- 1104 N 6th St
- 417 E Chestnut St
- 411 E Mulberry St
- 1124 N 6th St
- 1024 N 6th St
- 906 N 8th St
Your Personal Tour Guide
Ask me questions while you tour the home.