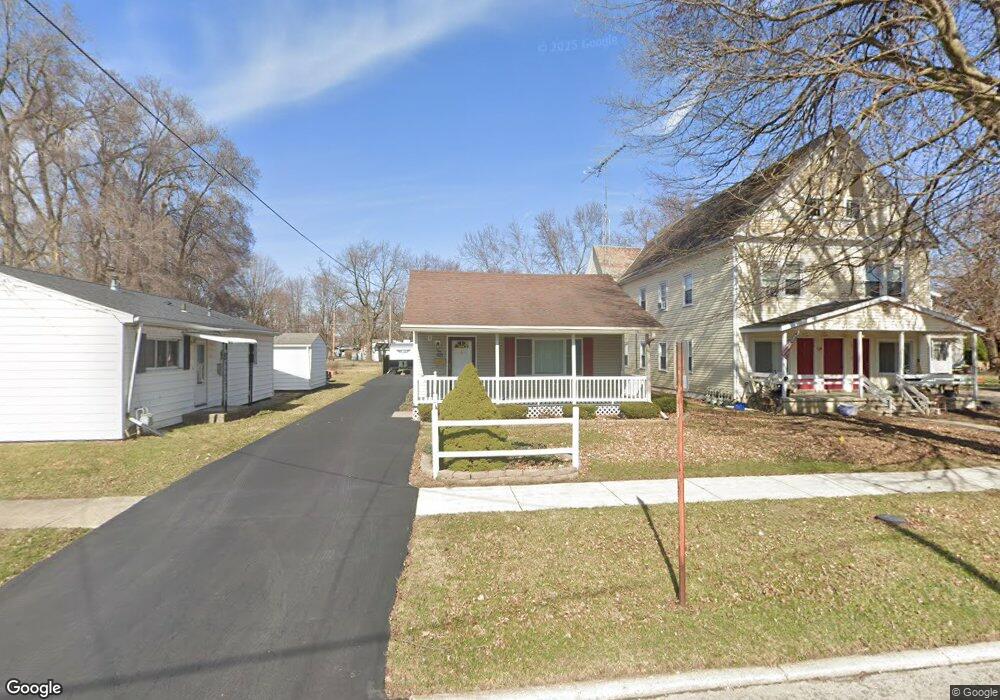
520 Eben Ave Findlay, OH 45840
Estimated Value: $146,000 - $171,000
2
Beds
1
Bath
1,026
Sq Ft
$159/Sq Ft
Est. Value
About This Home
This home is located at 520 Eben Ave, Findlay, OH 45840 and is currently estimated at $163,439, approximately $159 per square foot. 520 Eben Ave is a home located in Hancock County with nearby schools including Whittier Primary School, Bigelow Hill Elementary School, and Glenwood Middle School.
Ownership History
Date
Name
Owned For
Owner Type
Purchase Details
Closed on
Aug 11, 2003
Sold by
Coward James L and Coward Rebecca L
Bought by
Foreman Michael J
Current Estimated Value
Home Financials for this Owner
Home Financials are based on the most recent Mortgage that was taken out on this home.
Original Mortgage
$90,578
Outstanding Balance
$39,451
Interest Rate
5.47%
Mortgage Type
FHA
Estimated Equity
$123,988
Purchase Details
Closed on
Jul 28, 2003
Sold by
Nagy Steven M and Nagy Betty J
Bought by
Coward James L and Coward Rebecca L
Home Financials for this Owner
Home Financials are based on the most recent Mortgage that was taken out on this home.
Original Mortgage
$90,578
Outstanding Balance
$39,451
Interest Rate
5.47%
Mortgage Type
FHA
Estimated Equity
$123,988
Purchase Details
Closed on
May 4, 2000
Sold by
Nagy Steven M
Bought by
Coward James L and Coward Rebecca L
Purchase Details
Closed on
Jun 22, 1993
Bought by
Nagy Steven M and Nagy Betty J
Purchase Details
Closed on
Aug 10, 1988
Bought by
Gossard Mark S
Purchase Details
Closed on
Feb 23, 1984
Bought by
Wise James Lee
Create a Home Valuation Report for This Property
The Home Valuation Report is an in-depth analysis detailing your home's value as well as a comparison with similar homes in the area
Home Values in the Area
Average Home Value in this Area
Purchase History
| Date | Buyer | Sale Price | Title Company |
|---|---|---|---|
| Foreman Michael J | $92,000 | Midam Title | |
| Coward James L | -- | Mid Am Title | |
| Coward James L | $84,500 | -- | |
| Nagy Steven M | $55,000 | -- | |
| Gossard Mark S | $39,000 | -- | |
| Wise James Lee | $35,000 | -- |
Source: Public Records
Mortgage History
| Date | Status | Borrower | Loan Amount |
|---|---|---|---|
| Open | Foreman Michael J | $90,578 |
Source: Public Records
Tax History
| Year | Tax Paid | Tax Assessment Tax Assessment Total Assessment is a certain percentage of the fair market value that is determined by local assessors to be the total taxable value of land and additions on the property. | Land | Improvement |
|---|---|---|---|---|
| 2024 | $1,845 | $51,940 | $4,320 | $47,620 |
| 2023 | $1,848 | $51,940 | $4,320 | $47,620 |
| 2022 | $1,841 | $51,940 | $4,320 | $47,620 |
| 2021 | $1,636 | $40,190 | $4,550 | $35,640 |
| 2020 | $1,636 | $40,190 | $4,550 | $35,640 |
| 2019 | $1,603 | $40,190 | $4,550 | $35,640 |
| 2018 | $1,411 | $32,470 | $3,960 | $28,510 |
| 2017 | $1,412 | $32,470 | $3,960 | $28,510 |
| 2016 | $1,398 | $32,470 | $3,960 | $28,510 |
| 2015 | $1,352 | $30,930 | $2,380 | $28,550 |
| 2014 | $1,353 | $30,930 | $2,380 | $28,550 |
| 2012 | $1,363 | $30,930 | $2,380 | $28,550 |
Source: Public Records
Map
Nearby Homes
- 810 Mcconnell St
- 716 Winfield Ave
- 912 Parkside Place
- 439 Carnahan Ave
- 204 Laquineo St
- 322 Midland Ave
- 301 Allen Ave
- 1125 Glen Meadow Dr
- 640 Center St
- 523 Center St
- 1209 Heather Dr
- 206 Midland Ave
- 1062 Vincent St
- 1020 Country Club Dr
- 213 Cherry St
- 1142 Concord Ct
- 125 Cherry St
- 1308 Greendale Ave
- 1216 Concord Ct
- 706 N Cory St
Your Personal Tour Guide
Ask me questions while you tour the home.