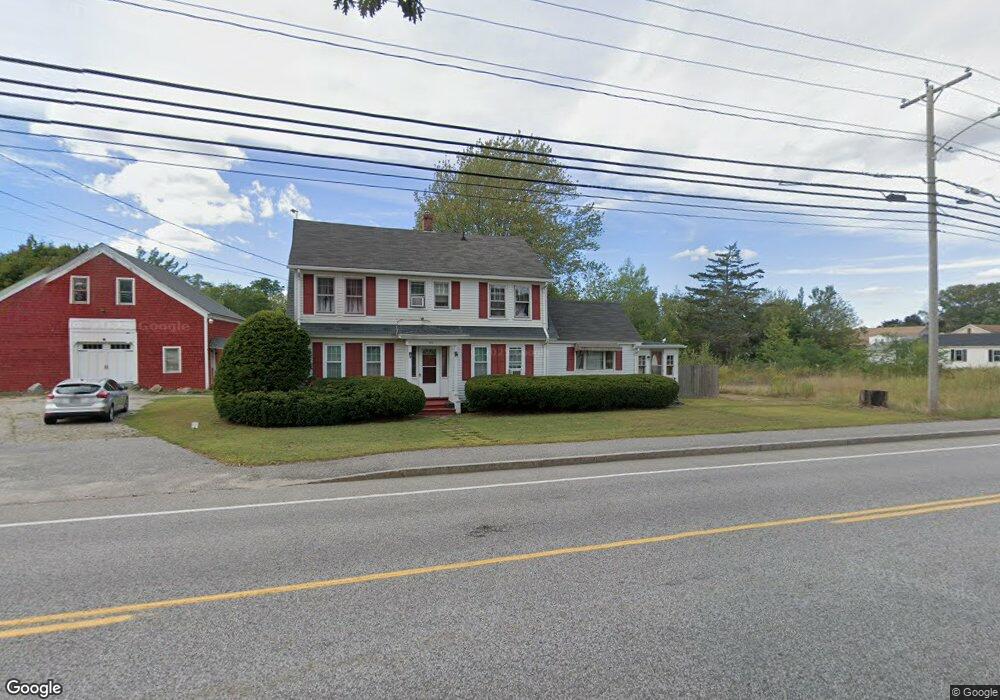
520 Elm St Biddeford, ME 04005
Estimated Value: $445,000 - $611,000
4
Beds
2
Baths
2,016
Sq Ft
$253/Sq Ft
Est. Value
About This Home
This home is located at 520 Elm St, Biddeford, ME 04005 and is currently estimated at $509,322, approximately $252 per square foot. 520 Elm St is a home located in York County with nearby schools including John F Kennedy Memorial School, Biddeford Intermediate School, and Biddeford Primary School.
Ownership History
Date
Name
Owned For
Owner Type
Purchase Details
Closed on
Feb 15, 2024
Sold by
Rioux Christopher D
Bought by
Spartan Holdings Llc
Current Estimated Value
Purchase Details
Closed on
Jan 31, 2017
Sold by
Peaslee Thomas
Bought by
Rioux Christopher D
Home Financials for this Owner
Home Financials are based on the most recent Mortgage that was taken out on this home.
Original Mortgage
$132,300
Interest Rate
4.16%
Mortgage Type
New Conventional
Purchase Details
Closed on
Apr 20, 2011
Sold by
Pelletier Jacques G and Sabr Mortgage Loan
Bought by
Sabr Mortage Loan
Create a Home Valuation Report for This Property
The Home Valuation Report is an in-depth analysis detailing your home's value as well as a comparison with similar homes in the area
Home Values in the Area
Average Home Value in this Area
Purchase History
| Date | Buyer | Sale Price | Title Company |
|---|---|---|---|
| Spartan Holdings Llc | -- | None Available | |
| Rioux Christopher D | -- | -- | |
| Sabr Mortage Loan | -- | -- | |
| Sabr Mortage Loan | -- | -- |
Source: Public Records
Mortgage History
| Date | Status | Borrower | Loan Amount |
|---|---|---|---|
| Previous Owner | Rioux Christopher D | $132,300 |
Source: Public Records
Tax History Compared to Growth
Tax History
| Year | Tax Paid | Tax Assessment Tax Assessment Total Assessment is a certain percentage of the fair market value that is determined by local assessors to be the total taxable value of land and additions on the property. | Land | Improvement |
|---|---|---|---|---|
| 2024 | $4,966 | $349,200 | $157,900 | $191,300 |
| 2023 | $4,545 | $346,400 | $157,900 | $188,500 |
| 2022 | $3,847 | $234,400 | $86,000 | $148,400 |
| 2021 | $3,668 | $201,200 | $71,700 | $129,500 |
| 2020 | $3,443 | $171,700 | $61,000 | $110,700 |
| 2019 | $3,431 | $171,700 | $61,000 | $110,700 |
| 2018 | $4,355 | $171,700 | $61,000 | $110,700 |
| 2017 | $5,409 | $167,300 | $61,000 | $106,300 |
| 2016 | $3,323 | $167,300 | $61,000 | $106,300 |
| 2015 | $3,257 | $167,300 | $61,000 | $106,300 |
| 2014 | $3,177 | $167,300 | $61,000 | $106,300 |
| 2013 | -- | $198,300 | $79,300 | $119,000 |
Source: Public Records
Map
Nearby Homes
- 433 Elm St
- 50 Landry St
- 30 Westland Ave
- 374-376 Alfred St
- 37 West St
- 312 Alfred St
- 49 Harding St
- 276 Hill St
- 4 Debbie Ave
- 47 Westmore Ave
- 2808 Portland Rd
- 5 Eastgate Ave
- 19 Lessard Ave
- 19 Alexander Dr
- 38 Westfield Extension
- 24 Lamothe Ave
- 7 Willett St
- 2 Berry Ln Unit 101
- 67 Wentworth St
- 63 Wentworth St