Estimated Value: $97,000 - $109,000
2
Beds
1
Bath
852
Sq Ft
$121/Sq Ft
Est. Value
About This Home
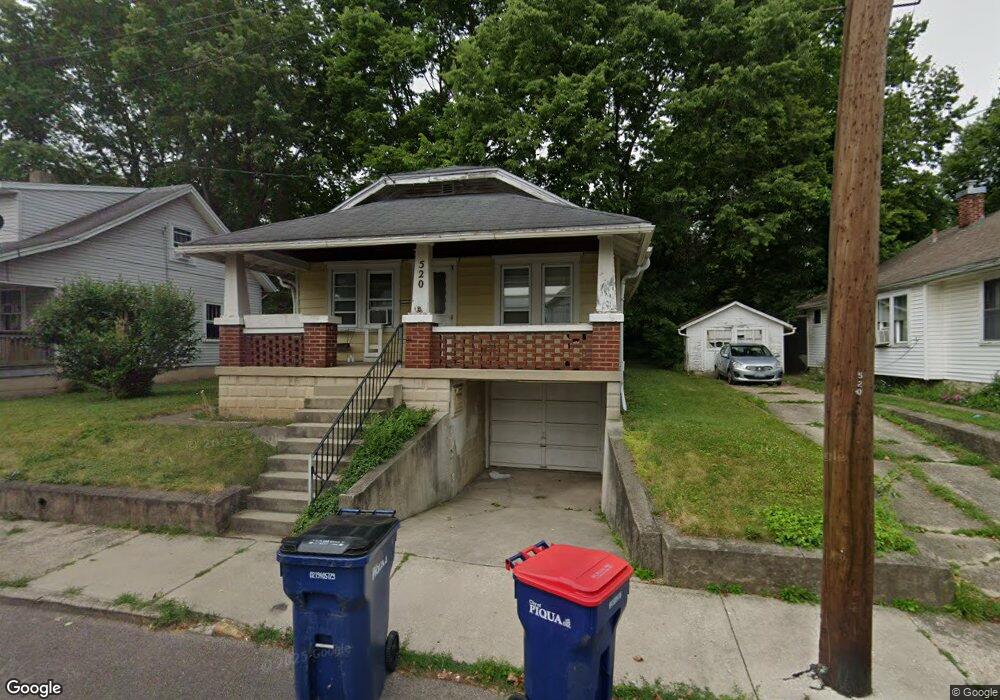
This home is located at 520 Gordon St, Piqua, OH 45356 and is currently estimated at $103,000, approximately $120 per square foot. 520 Gordon St is a home located in Miami County with nearby schools including Piqua Junior High School, Piqua High School, and Nicholas School.
Ownership History
Date
Name
Owned For
Owner Type
Purchase Details
Closed on
Dec 22, 2022
Sold by
Seipel Rickey L and Seipel Karen L
Bought by
Dsk Portfolio 16 Main Llc
Current Estimated Value
Home Financials for this Owner
Home Financials are based on the most recent Mortgage that was taken out on this home.
Original Mortgage
$706,400
Interest Rate
7.08%
Mortgage Type
Credit Line Revolving
Purchase Details
Closed on
Sep 25, 1995
Sold by
Fifth Third Bank Trustee
Bought by
Seipel Rickey L and Seipel Karen L
Home Financials for this Owner
Home Financials are based on the most recent Mortgage that was taken out on this home.
Original Mortgage
$29,600
Interest Rate
7.5%
Mortgage Type
New Conventional
Create a Home Valuation Report for This Property
The Home Valuation Report is an in-depth analysis detailing your home's value as well as a comparison with similar homes in the area
Home Values in the Area
Average Home Value in this Area
Purchase History
| Date | Buyer | Sale Price | Title Company |
|---|---|---|---|
| Dsk Portfolio 16 Main Llc | $883,000 | -- | |
| Seipel Rickey L | $79,000 | -- |
Source: Public Records
Mortgage History
| Date | Status | Borrower | Loan Amount |
|---|---|---|---|
| Closed | Dsk Portfolio 16 Main Llc | $706,400 | |
| Previous Owner | Seipel Rickey L | $29,600 |
Source: Public Records
Tax History
| Year | Tax Paid | Tax Assessment Tax Assessment Total Assessment is a certain percentage of the fair market value that is determined by local assessors to be the total taxable value of land and additions on the property. | Land | Improvement |
|---|---|---|---|---|
| 2024 | $798 | $11,520 | $4,900 | $6,620 |
| 2023 | $486 | $11,520 | $4,900 | $6,620 |
| 2022 | $494 | $11,520 | $4,900 | $6,620 |
| 2021 | $399 | $8,540 | $3,640 | $4,900 |
| 2020 | $393 | $8,540 | $3,640 | $4,900 |
| 2019 | $395 | $8,540 | $3,640 | $4,900 |
| 2018 | $452 | $9,320 | $3,680 | $5,640 |
| 2017 | $457 | $9,320 | $3,680 | $5,640 |
| 2016 | $453 | $9,320 | $3,680 | $5,640 |
| 2015 | $446 | $8,970 | $3,540 | $5,430 |
| 2014 | $446 | $8,970 | $3,540 | $5,430 |
| 2013 | $447 | $8,970 | $3,540 | $5,430 |
Source: Public Records
Map
Nearby Homes
Your Personal Tour Guide
Ask me questions while you tour the home.