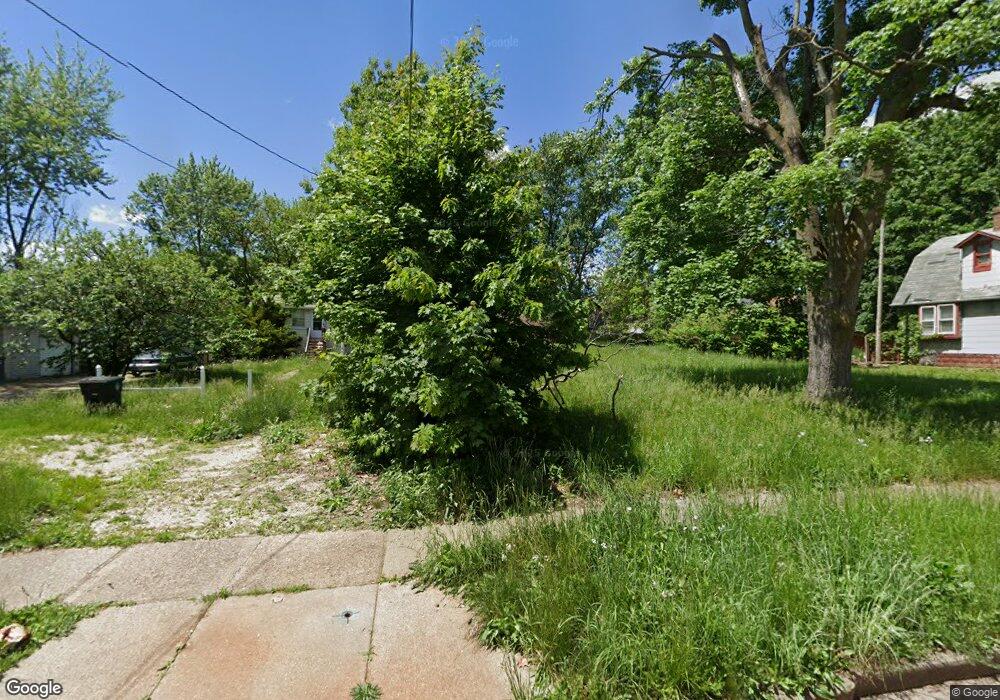
520 Gridley St Akron, OH 44306
Downtown Akron NeighborhoodEstimated Value: $73,000 - $138,000
2
Beds
1
Bath
741
Sq Ft
$129/Sq Ft
Est. Value
About This Home
This home is located at 520 Gridley St, Akron, OH 44306 and is currently estimated at $95,667, approximately $129 per square foot. 520 Gridley St is a home located in Summit County with nearby schools including Case Preparatory Academy, Middlebury Academy, and Arlington Christian Academy.
Ownership History
Date
Name
Owned For
Owner Type
Purchase Details
Closed on
Feb 18, 2009
Sold by
Go Invest Wisely Llc
Bought by
Commodore Housing Llc
Current Estimated Value
Purchase Details
Closed on
Dec 3, 2008
Sold by
Bryce Peters Financial
Bought by
Go Invest Wisely Llc
Purchase Details
Closed on
Aug 19, 2008
Sold by
Citimortgage Inc
Bought by
Bryce Peters Financial Corp
Purchase Details
Closed on
Feb 19, 2008
Sold by
Potts Byrl
Bought by
Citimortgage Inc
Create a Home Valuation Report for This Property
The Home Valuation Report is an in-depth analysis detailing your home's value as well as a comparison with similar homes in the area
Home Values in the Area
Average Home Value in this Area
Purchase History
| Date | Buyer | Sale Price | Title Company |
|---|---|---|---|
| Commodore Housing Llc | $500 | None Available | |
| Go Invest Wisely Llc | $4,400 | North American Title & Servi | |
| Bryce Peters Financial Corp | $39,590 | Loss Mitigation Title Servic | |
| Citimortgage Inc | $30,015 | None Available |
Source: Public Records
Tax History Compared to Growth
Tax History
| Year | Tax Paid | Tax Assessment Tax Assessment Total Assessment is a certain percentage of the fair market value that is determined by local assessors to be the total taxable value of land and additions on the property. | Land | Improvement |
|---|---|---|---|---|
| 2025 | $29,727 | $3,483 | $3,483 | -- |
| 2024 | $29,727 | $3,483 | $3,483 | -- |
| 2023 | $236 | $3,483 | $3,483 | -- |
| 2022 | $236 | $2,401 | $2,401 | $0 |
| 2021 | $554 | $2,401 | $2,401 | $0 |
| 2020 | $1,061 | $2,400 | $2,400 | $0 |
| 2019 | $1,195 | $4,060 | $4,060 | $0 |
| 2018 | $826 | $4,060 | $4,060 | $0 |
| 2017 | $1,329 | $4,060 | $4,060 | $0 |
| 2016 | $1,329 | $4,060 | $4,060 | $0 |
| 2015 | $1,329 | $4,060 | $4,060 | $0 |
| 2014 | $1,071 | $4,060 | $4,060 | $0 |
| 2013 | $362 | $4,060 | $4,060 | $0 |
Source: Public Records
Map
Nearby Homes