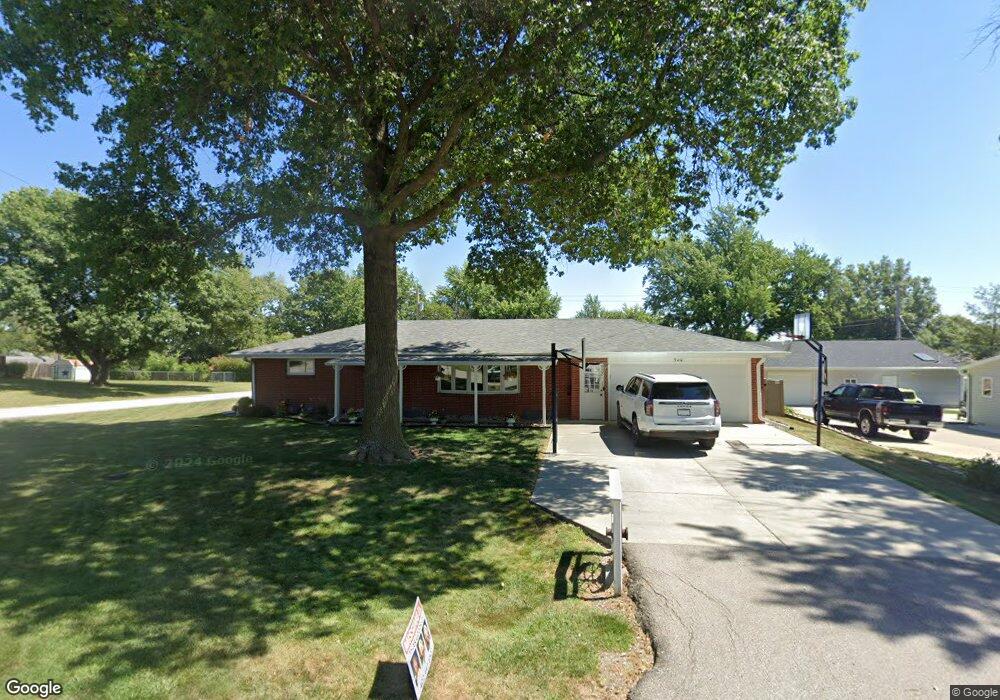
520 Harrison St Bennet, NE 68317
Estimated Value: $160,000 - $275,816
2
Beds
1
Bath
1,170
Sq Ft
$194/Sq Ft
Est. Value
About This Home
This home is located at 520 Harrison St, Bennet, NE 68317 and is currently estimated at $226,454, approximately $193 per square foot. 520 Harrison St is a home located in Lancaster County with nearby schools including Elementary at Bennet and Junior/Senior High School at Palmyra.
Ownership History
Date
Name
Owned For
Owner Type
Purchase Details
Closed on
Jul 17, 2017
Sold by
Cheney Judy Rose and Williams Judy Rose
Bought by
Cheney Dennis and Cheney Judy
Current Estimated Value
Purchase Details
Closed on
Apr 19, 2007
Sold by
Williams Anthony Dwight
Bought by
Williams Judy Rose
Create a Home Valuation Report for This Property
The Home Valuation Report is an in-depth analysis detailing your home's value as well as a comparison with similar homes in the area
Purchase History
| Date | Buyer | Sale Price | Title Company |
|---|---|---|---|
| Cheney Dennis | -- | None Available | |
| Williams Judy Rose | -- | None Available |
Source: Public Records
Tax History
| Year | Tax Paid | Tax Assessment Tax Assessment Total Assessment is a certain percentage of the fair market value that is determined by local assessors to be the total taxable value of land and additions on the property. | Land | Improvement |
|---|---|---|---|---|
| 2025 | $3,324 | $280,400 | $70,000 | $210,400 |
| 2024 | $3,324 | $258,100 | $62,000 | $196,100 |
| 2023 | $4,509 | $258,100 | $62,000 | $196,100 |
| 2022 | $4,081 | $215,900 | $48,000 | $167,900 |
| 2021 | $3,849 | $215,900 | $48,000 | $167,900 |
| 2020 | $2,742 | $148,200 | $48,000 | $100,200 |
| 2019 | $2,406 | $129,300 | $48,000 | $81,300 |
| 2018 | $3,159 | $163,200 | $35,000 | $128,200 |
| 2017 | $3,057 | $163,200 | $35,000 | $128,200 |
| 2016 | $2,972 | $145,400 | $30,000 | $115,400 |
| 2015 | $2,911 | $145,400 | $30,000 | $115,400 |
| 2014 | $2,874 | $140,800 | $30,000 | $110,800 |
| 2013 | -- | $140,800 | $30,000 | $110,800 |
Source: Public Records
Map
Nearby Homes
- 1240 Hackberry St
- 400 Evergreen Rd
- 1240 Evergreen Rd
- 1140 Evergreen Rd
- 920 Evergreen Rd
- 1180 Evergreen Rd
- 1245 Evergreen Rd
- 405 Evergreen Rd
- 985 Evergreen Rd
- 1201 Evergreen Rd
- 1167 Evergreen Rd
- 1020 Evergreen Rd
- 1125 Evergreen Rd
- 945 Evergreen Rd
- 1005 Evergreen Rd
- 1100 Evergreen Rd
- 915 Evergreen Rd
- 940 Evergreen Rd
- 1040 Evergreen Rd
- 1220 Evergreen Rd
Your Personal Tour Guide
Ask me questions while you tour the home.