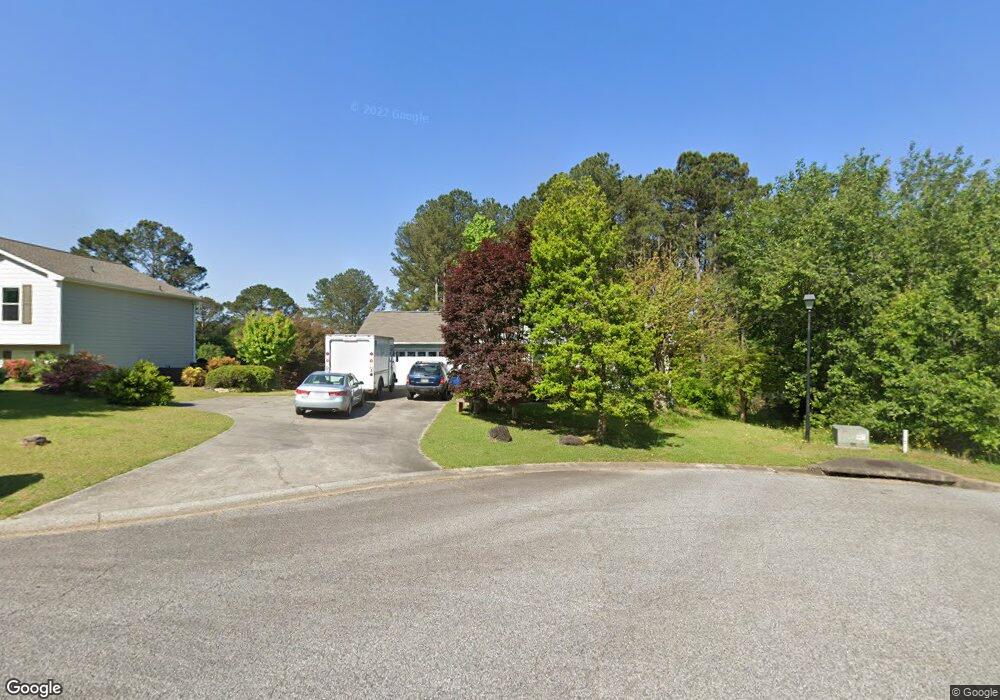
520 Heritage Ln Unit 2 Winder, GA 30680
Estimated Value: $255,467 - $298,000
3
Beds
2
Baths
1,144
Sq Ft
$240/Sq Ft
Est. Value
About This Home
This home is located at 520 Heritage Ln Unit 2, Winder, GA 30680 and is currently estimated at $275,117, approximately $240 per square foot. 520 Heritage Ln Unit 2 is a home located in Barrow County with nearby schools including Kennedy Elementary School, Westside Middle School, and Apalachee High School.
Ownership History
Date
Name
Owned For
Owner Type
Purchase Details
Closed on
Jan 2, 2001
Sold by
Perkins Cecilia L
Bought by
Perkins Ceclila L and Perkins James W
Current Estimated Value
Home Financials for this Owner
Home Financials are based on the most recent Mortgage that was taken out on this home.
Original Mortgage
$87,604
Outstanding Balance
$32,581
Interest Rate
7.65%
Mortgage Type
FHA
Estimated Equity
$242,536
Purchase Details
Closed on
Dec 16, 1998
Sold by
Czajkowski Steven J
Bought by
Watkins Terrin Reed and Watkins Kimber
Home Financials for this Owner
Home Financials are based on the most recent Mortgage that was taken out on this home.
Original Mortgage
$83,742
Interest Rate
6.9%
Mortgage Type
FHA
Purchase Details
Closed on
May 27, 1994
Sold by
Breedlove George R
Bought by
Czajkowski Steven J
Purchase Details
Closed on
Mar 11, 1994
Bought by
Breedlove George R
Create a Home Valuation Report for This Property
The Home Valuation Report is an in-depth analysis detailing your home's value as well as a comparison with similar homes in the area
Home Values in the Area
Average Home Value in this Area
Purchase History
| Date | Buyer | Sale Price | Title Company |
|---|---|---|---|
| Perkins Ceclila L | -- | -- | |
| Perkins Cecilila L | $95,900 | -- | |
| Watkins Terrin Reed | $84,000 | -- | |
| Czajkowski Steven J | $75,000 | -- | |
| Breedlove George R | $12,000 | -- |
Source: Public Records
Mortgage History
| Date | Status | Borrower | Loan Amount |
|---|---|---|---|
| Open | Perkins Cecilila L | $87,604 | |
| Previous Owner | Watkins Terrin Reed | $83,742 |
Source: Public Records
Tax History Compared to Growth
Tax History
| Year | Tax Paid | Tax Assessment Tax Assessment Total Assessment is a certain percentage of the fair market value that is determined by local assessors to be the total taxable value of land and additions on the property. | Land | Improvement |
|---|---|---|---|---|
| 2024 | $551 | $64,327 | $15,200 | $49,127 |
| 2023 | $1,171 | $64,327 | $15,200 | $49,127 |
| 2022 | $1,603 | $56,873 | $15,200 | $41,673 |
| 2021 | $1,684 | $56,873 | $15,200 | $41,673 |
| 2020 | $1,530 | $51,705 | $12,980 | $38,725 |
| 2019 | $1,340 | $44,629 | $11,800 | $32,829 |
| 2018 | $1,318 | $44,629 | $11,800 | $32,829 |
| 2017 | $994 | $34,130 | $11,800 | $22,330 |
| 2016 | $975 | $34,408 | $11,800 | $22,608 |
| 2015 | $988 | $34,686 | $11,800 | $22,886 |
| 2014 | $811 | $28,945 | $5,782 | $23,163 |
| 2013 | -- | $28,126 | $5,782 | $22,344 |
Source: Public Records
Map
Nearby Homes
- 256 Oceanliner Dr
- 252 Oceanliner Dr
- 812 Castilla Way
- 245 Oceanliner Dr
- 1106 Sutherland Dr
- 536 Dianne Ct
- 1053 Sutherland Dr
- 1048 Sutherland Dr
- 1076 Sutherland Dr
- 0 Atlanta Hwy SE Unit 10371310
- 435 Watson Rd
- 29 Lighthouse Dr
- 0 Gordon Ct Unit 10634940
- 0 Gordon Ct Unit 7674399
- 211 Brooks Ln
- 40 Huckleberry Ln
- 55 Huckleberry Ln
- 328 Advent Dr
- 182 Nativity Cove Unit 30
- 182 Nativity Cove
- 518 Heritage Ln Unit 2
- 522 Heritage Ln Unit 2
- 516 Heritage Ln
- 519 Heritage Ln
- 519 Heritage Ln Unit 44
- 517 Heritage Ln Unit 2
- 514 Heritage Ln Unit 2
- 444 Russell Cemetery Rd
- 446 Russell Cemetery Rd
- 515 Heritage Ln
- 442 Russell Cemetery Rd
- 448 Russell Cemetery Rd Unit 1
- 448 Russell Cemetery Rd Unit 68
- 512 Heritage Ln Unit 2
- 450 Russell Cemetery Rd
- 604 Century Dr
- 0 Century Dr Unit 3113082
- 452 Russell Cemetery Rd
- 452 Russell Cemetery Rd Unit 1
- 510 Heritage Ln Unit 2