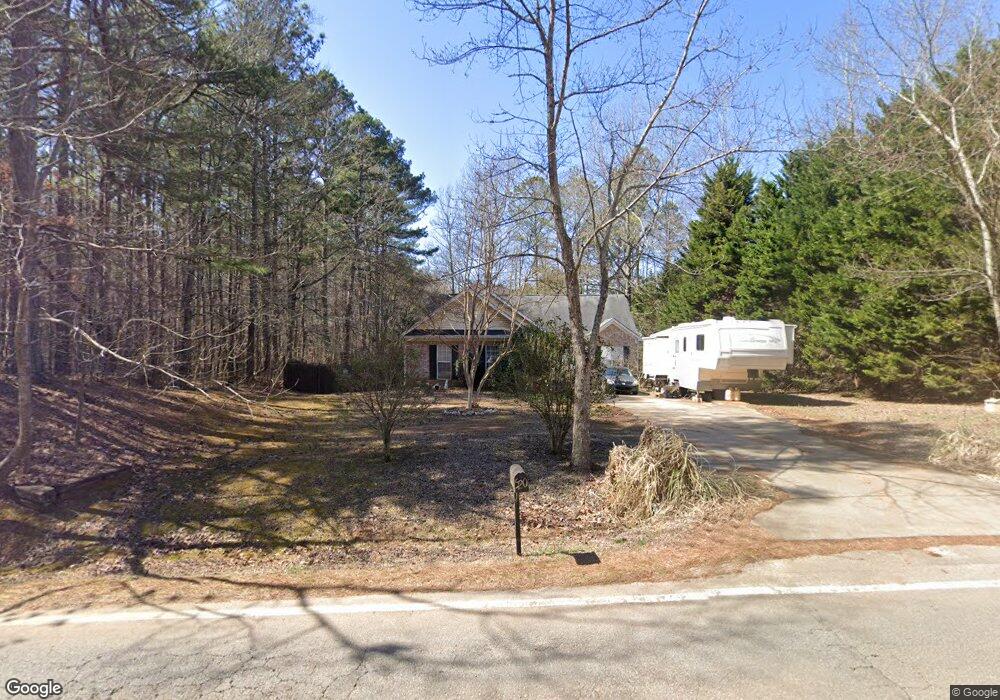
520 Herrell Rd Villa Rica, GA 30180
Estimated Value: $272,250 - $293,000
3
Beds
2
Baths
1,337
Sq Ft
$212/Sq Ft
Est. Value
About This Home
This home is located at 520 Herrell Rd, Villa Rica, GA 30180 and is currently estimated at $284,063, approximately $212 per square foot. 520 Herrell Rd is a home located in Carroll County with nearby schools including Glanton-Hindsman Elementary School, Villa Rica Middle School, and Villa Rica High School.
Ownership History
Date
Name
Owned For
Owner Type
Purchase Details
Closed on
Sep 15, 2005
Sold by
Smitherman John P
Bought by
Norris Jennifer
Current Estimated Value
Home Financials for this Owner
Home Financials are based on the most recent Mortgage that was taken out on this home.
Original Mortgage
$113,600
Outstanding Balance
$62,785
Interest Rate
6.38%
Mortgage Type
New Conventional
Estimated Equity
$221,278
Purchase Details
Closed on
Feb 27, 2004
Sold by
Sunshine Building & Developmen
Bought by
Smitherman John P
Purchase Details
Closed on
Feb 7, 2003
Sold by
Amidon Perry E and Amidon Bonnie
Bought by
Sunshine Building & Development Llc
Purchase Details
Closed on
Apr 15, 2002
Sold by
Sosebee Wanda E
Bought by
Amidon Perry E and Amidon Bonnie
Purchase Details
Closed on
Feb 25, 1994
Bought by
Sosebee Wanda E
Purchase Details
Closed on
Nov 1, 1989
Bought by
Sosebee Wanda and Sosebee Birt
Create a Home Valuation Report for This Property
The Home Valuation Report is an in-depth analysis detailing your home's value as well as a comparison with similar homes in the area
Home Values in the Area
Average Home Value in this Area
Purchase History
| Date | Buyer | Sale Price | Title Company |
|---|---|---|---|
| Norris Jennifer | $142,000 | -- | |
| Smitherman John P | $123,900 | -- | |
| Sunshine Building & Development Llc | $30,000 | -- | |
| Amidon Perry E | $18,500 | -- | |
| Sosebee Wanda E | -- | -- | |
| Sosebee Wanda | -- | -- |
Source: Public Records
Mortgage History
| Date | Status | Borrower | Loan Amount |
|---|---|---|---|
| Open | Norris Jennifer | $113,600 | |
| Closed | Norris Jennifer | $28,400 |
Source: Public Records
Tax History Compared to Growth
Tax History
| Year | Tax Paid | Tax Assessment Tax Assessment Total Assessment is a certain percentage of the fair market value that is determined by local assessors to be the total taxable value of land and additions on the property. | Land | Improvement |
|---|---|---|---|---|
| 2024 | $1,958 | $106,732 | $9,867 | $96,865 |
| 2023 | $1,958 | $95,946 | $7,894 | $88,052 |
| 2022 | $1,602 | $75,949 | $5,263 | $70,686 |
| 2021 | $1,437 | $64,658 | $4,210 | $60,448 |
| 2020 | $1,316 | $57,814 | $3,827 | $53,987 |
| 2019 | $1,235 | $52,808 | $3,827 | $48,981 |
| 2018 | $1,101 | $45,937 | $3,577 | $42,360 |
| 2017 | $1,105 | $45,937 | $3,577 | $42,360 |
| 2016 | $1,105 | $45,937 | $3,577 | $42,360 |
| 2015 | $1,265 | $49,240 | $8,800 | $40,440 |
| 2014 | $1,271 | $49,240 | $8,800 | $40,440 |
Source: Public Records
Map
Nearby Homes
- 0001 Twin Lakes Dr
- 560 Herrell Rd
- 460 Herrell Rd
- 0 Lorie Loaf
- 545 Herrell Rd
- 37 Twin Lakes Dr
- 328 Bonnie Sue Dr Unit LOT 27
- 332 Bonnie Sue Dr
- 340 Bonnie Sue Dr
- 580 Herrell Rd
- 344 Bonnie Sue Dr
- 316 Bonnie Sue Dr
- 324 Bonnie Sue Dr
- 348 Bonnie Sue Dr
- 312 Bonnie Sue Dr
- 333 Bonnie Sue Dr
- 352 Bonnie Sue Dr
- 615 Herrell Rd
- 100 Red Branch Dr
- 100 Red Branch Dr