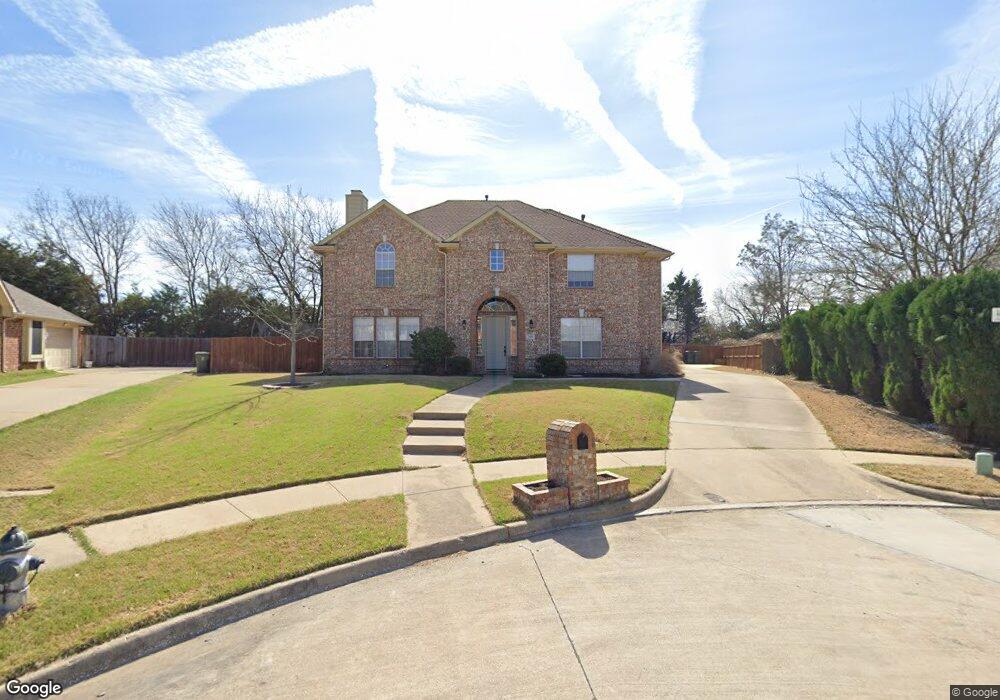
520 Hickory Dr Murphy, TX 75094
Estimated Value: $564,000 - $631,000
5
Beds
4
Baths
3,333
Sq Ft
$177/Sq Ft
Est. Value
About This Home
This home is located at 520 Hickory Dr, Murphy, TX 75094 and is currently estimated at $590,796, approximately $177 per square foot. 520 Hickory Dr is a home located in Collin County with nearby schools including Miller Elementary School, Murphy Middle School, and C A Mcmillen High School.
Ownership History
Date
Name
Owned For
Owner Type
Purchase Details
Closed on
Dec 1, 2022
Sold by
Forsythia Investment Properties Llc-Seri
Bought by
Sykes Eslie and Sykes Susan
Current Estimated Value
Home Financials for this Owner
Home Financials are based on the most recent Mortgage that was taken out on this home.
Original Mortgage
$400,000
Outstanding Balance
$386,380
Interest Rate
6.95%
Mortgage Type
Seller Take Back
Estimated Equity
$204,416
Purchase Details
Closed on
Jan 11, 2017
Sold by
Driver Samuel F and Driver Stefanie S
Bought by
Forsythia Investment Properties Llc
Purchase Details
Closed on
Dec 18, 2000
Sold by
U S Home Corp
Bought by
Driver Samuel F and Driver Stefanie S
Home Financials for this Owner
Home Financials are based on the most recent Mortgage that was taken out on this home.
Original Mortgage
$202,961
Interest Rate
7.78%
Mortgage Type
VA
Create a Home Valuation Report for This Property
The Home Valuation Report is an in-depth analysis detailing your home's value as well as a comparison with similar homes in the area
Home Values in the Area
Average Home Value in this Area
Purchase History
| Date | Buyer | Sale Price | Title Company |
|---|---|---|---|
| Sykes Eslie | -- | None Listed On Document | |
| Sykes Carolyn Anne | -- | -- | |
| Sykes Eslie | -- | -- | |
| Forsythia Investment Properties Llc | -- | None Available | |
| Driver Samuel F | -- | -- |
Source: Public Records
Mortgage History
| Date | Status | Borrower | Loan Amount |
|---|---|---|---|
| Open | Sykes Carolyn Anne | $400,000 | |
| Closed | Sykes Eslie | $400,000 | |
| Previous Owner | Driver Samuel F | $202,961 |
Source: Public Records
Tax History
| Year | Tax Paid | Tax Assessment Tax Assessment Total Assessment is a certain percentage of the fair market value that is determined by local assessors to be the total taxable value of land and additions on the property. | Land | Improvement |
|---|---|---|---|---|
| 2025 | $8,347 | $573,809 | $132,250 | $441,559 |
| 2024 | $8,347 | $582,533 | -- | -- |
| 2023 | $7,887 | $529,575 | $132,250 | $397,325 |
| 2022 | $8,840 | $451,383 | $115,000 | $336,383 |
| 2021 | $7,451 | $360,789 | $92,000 | $268,789 |
| 2020 | $7,491 | $358,663 | $80,500 | $278,163 |
| 2019 | $8,010 | $365,594 | $80,500 | $285,094 |
| 2018 | $8,111 | $366,847 | $80,500 | $286,347 |
| 2017 | $7,252 | $327,968 | $80,500 | $247,468 |
| 2016 | $7,150 | $319,414 | $69,000 | $250,414 |
| 2015 | $5,721 | $281,705 | $51,750 | $229,955 |
Source: Public Records
Map
Nearby Homes
- 428 Rainforest Ct
- 316 Mimosa Dr
- 524 Jasmine Dr
- 465 Kinney Dr
- 108 Starlite Dr
- 300 Shady Timbers Ln
- 402 S Maxwell Creek Rd
- 202 Sweetgum Dr
- 155 Sunset Dr
- 505 Horizon Ct
- 110 Birch Blvd
- 5811 Abingdon Dr
- 412 Skyline Dr
- 600 E Fm 544
- 602 Stone Hearth Ln
- Lot 1 Maxwell Creek Rd
- LOT 2 Maxwell Creek Rd
- 101 Hawthorne Dr
- 3314 Grandview Dr
- 1008 Yarnell Place
- 342 Kentwood Dr
- 516 Hickory Dr
- 512 Hickory Dr
- 338 Kentwood Dr
- 517 Hickory Dr
- 553 Kinney Dr
- 508 Hickory Dr
- 513 Hickory Dr
- 334 Kentwood Dr
- 509 Hickory Dr
- 331 Kentwood Dr
- 504 Hickory Dr
- 330 Kentwood Dr
- 505 Hickory Dr
- 206 Starlite Dr
- 500 Hickory Dr
- 326 Kentwood Dr
- 448 Rainforest Ct
- 501 Hickory Dr
- 4 N Star Rd
Your Personal Tour Guide
Ask me questions while you tour the home.