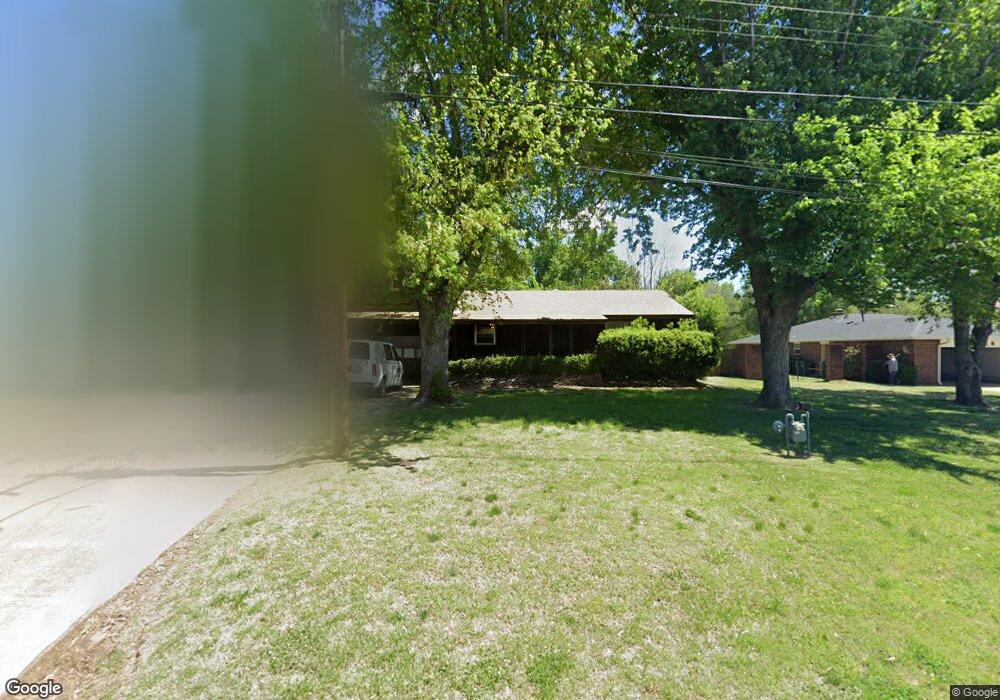
520 Howard Dr Oklahoma City, OK 73115
Estimated Value: $181,000 - $216,375
4
Beds
2
Baths
1,084
Sq Ft
$183/Sq Ft
Est. Value
About This Home
This home is located at 520 Howard Dr, Oklahoma City, OK 73115 and is currently estimated at $198,094, approximately $182 per square foot. 520 Howard Dr is a home located in Oklahoma County with nearby schools including Bonham Elementary School, Midwest City Elementary School, and Rice Challenge Academy.
Ownership History
Date
Name
Owned For
Owner Type
Purchase Details
Closed on
Feb 26, 2008
Sold by
Parker Donald H
Bought by
Johnson Russet and Dufur Julie
Current Estimated Value
Home Financials for this Owner
Home Financials are based on the most recent Mortgage that was taken out on this home.
Original Mortgage
$86,921
Outstanding Balance
$54,092
Interest Rate
5.72%
Mortgage Type
FHA
Estimated Equity
$144,002
Purchase Details
Closed on
Nov 22, 2002
Sold by
Moore Merle C and Moore Alexis N
Bought by
Parker Donald H
Create a Home Valuation Report for This Property
The Home Valuation Report is an in-depth analysis detailing your home's value as well as a comparison with similar homes in the area
Home Values in the Area
Average Home Value in this Area
Purchase History
| Date | Buyer | Sale Price | Title Company |
|---|---|---|---|
| Johnson Russet | $97,500 | Lawyers Title Of Ok City Inc | |
| Parker Donald H | $92,500 | Stewart Escrow & Title | |
| Moore Merle C | -- | Stewart Escrow & Title |
Source: Public Records
Mortgage History
| Date | Status | Borrower | Loan Amount |
|---|---|---|---|
| Open | Johnson Russet | $86,921 |
Source: Public Records
Tax History Compared to Growth
Tax History
| Year | Tax Paid | Tax Assessment Tax Assessment Total Assessment is a certain percentage of the fair market value that is determined by local assessors to be the total taxable value of land and additions on the property. | Land | Improvement |
|---|---|---|---|---|
| 2024 | $1,557 | $15,289 | $3,360 | $11,929 |
| 2023 | $1,557 | $14,844 | $2,685 | $12,159 |
| 2022 | $1,485 | $14,411 | $2,847 | $11,564 |
| 2021 | $1,490 | $13,992 | $3,303 | $10,689 |
| 2020 | $1,482 | $13,585 | $3,531 | $10,054 |
| 2019 | $1,457 | $13,765 | $5,009 | $8,756 |
| 2018 | $1,432 | $13,365 | $0 | $0 |
| 2017 | $1,423 | $13,199 | $5,024 | $8,175 |
| 2016 | $1,430 | $12,930 | $5,005 | $7,925 |
| 2015 | $1,393 | $12,553 | $3,655 | $8,898 |
| 2014 | $1,345 | $12,188 | $3,702 | $8,486 |
Source: Public Records
Map
Nearby Homes
- 4720 Trapp Dr
- 605 S Sooner Rd
- 4800 Gina Place
- 1017 Howard Dr
- 410 Vickie Dr
- 4812 Del Crest Dr
- 816 S Sooner Rd
- 4916 Jeffery Dr
- 310 S Sooner Rd
- 5804 SE 7th St
- 4937 Jeffery Dr
- 4761 Koelsch Dr
- 720 Del Haven Dr
- 1306 Sean Ct
- 1311 Sean Ct
- 4412 E Reno St
- 613 Mark Dr
- 4408 E Reno Ave
- 4345 Woodedge Dr
- 1020 Harold Dr