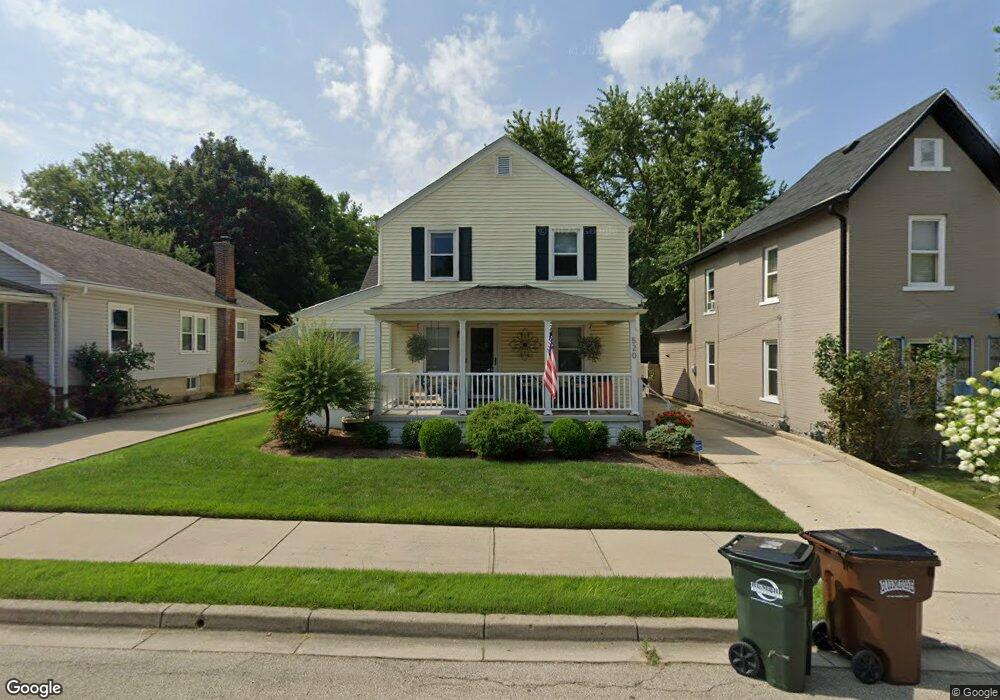
520 Jefferson St Miamisburg, OH 45342
Downtown Miamisburg NeighborhoodEstimated Value: $236,637 - $278,000
4
Beds
2
Baths
1,860
Sq Ft
$142/Sq Ft
Est. Value
About This Home
This home is located at 520 Jefferson St, Miamisburg, OH 45342 and is currently estimated at $263,909, approximately $141 per square foot. 520 Jefferson St is a home located in Montgomery County with nearby schools including Miamisburg High School and Bethel Baptist School.
Ownership History
Date
Name
Owned For
Owner Type
Purchase Details
Closed on
Nov 1, 2017
Sold by
Wooldridge Jedidiah I and Wooldridge Bailey M
Bought by
Genth Clayton M and Mcgullion Sarah A
Current Estimated Value
Home Financials for this Owner
Home Financials are based on the most recent Mortgage that was taken out on this home.
Original Mortgage
$142,500
Outstanding Balance
$119,345
Interest Rate
3.83%
Mortgage Type
New Conventional
Estimated Equity
$144,564
Purchase Details
Closed on
Oct 9, 2012
Sold by
Gebhart Dennis M and Gebhart Brenda S
Bought by
Woolbridge Jedidiah L and Wooldridge Bailey M
Home Financials for this Owner
Home Financials are based on the most recent Mortgage that was taken out on this home.
Original Mortgage
$93,279
Interest Rate
3.37%
Mortgage Type
FHA
Create a Home Valuation Report for This Property
The Home Valuation Report is an in-depth analysis detailing your home's value as well as a comparison with similar homes in the area
Home Values in the Area
Average Home Value in this Area
Purchase History
| Date | Buyer | Sale Price | Title Company |
|---|---|---|---|
| Genth Clayton M | $142,500 | Sterling Land Title Agency I | |
| Woolbridge Jedidiah L | $95,000 | Ladmark Title Agency South I |
Source: Public Records
Mortgage History
| Date | Status | Borrower | Loan Amount |
|---|---|---|---|
| Open | Genth Clayton M | $142,500 | |
| Closed | Woolbridge Jedidiah L | $93,279 |
Source: Public Records
Tax History Compared to Growth
Tax History
| Year | Tax Paid | Tax Assessment Tax Assessment Total Assessment is a certain percentage of the fair market value that is determined by local assessors to be the total taxable value of land and additions on the property. | Land | Improvement |
|---|---|---|---|---|
| 2024 | $3,105 | $69,050 | $6,040 | $63,010 |
| 2023 | $3,105 | $69,050 | $6,040 | $63,010 |
| 2022 | $3,697 | $47,960 | $4,200 | $43,760 |
| 2021 | $3,282 | $47,960 | $4,200 | $43,760 |
| 2020 | $3,274 | $47,960 | $4,200 | $43,760 |
| 2019 | $2,210 | $30,390 | $4,200 | $26,190 |
| 2018 | $2,218 | $30,390 | $4,200 | $26,190 |
| 2017 | $2,202 | $30,390 | $4,200 | $26,190 |
| 2016 | $2,237 | $29,760 | $4,200 | $25,560 |
| 2015 | $2,193 | $29,760 | $4,200 | $25,560 |
| 2014 | $2,193 | $29,760 | $4,200 | $25,560 |
| 2012 | -- | $27,880 | $6,120 | $21,760 |
Source: Public Records
Map
Nearby Homes
- 513 Mound Ave
- 619 Jefferson St
- 805 E Linden Ave
- 460 S 8th St
- 736 Park Ave
- 425 Early Dr W
- 24 S 8th St
- 224 Suttman St
- 607 E Central Ave
- 740 E Central Ave
- 111 Old Main St
- 111 S Main St
- 42 S Main St
- 1196 E Linden Ave
- 801 Fairway Ct
- 555 E Sycamore St
- 7 N Riverview Ave
- 1187 Mary Ln W
- 265 S Riverview Ave
- 1137 E Pearl St