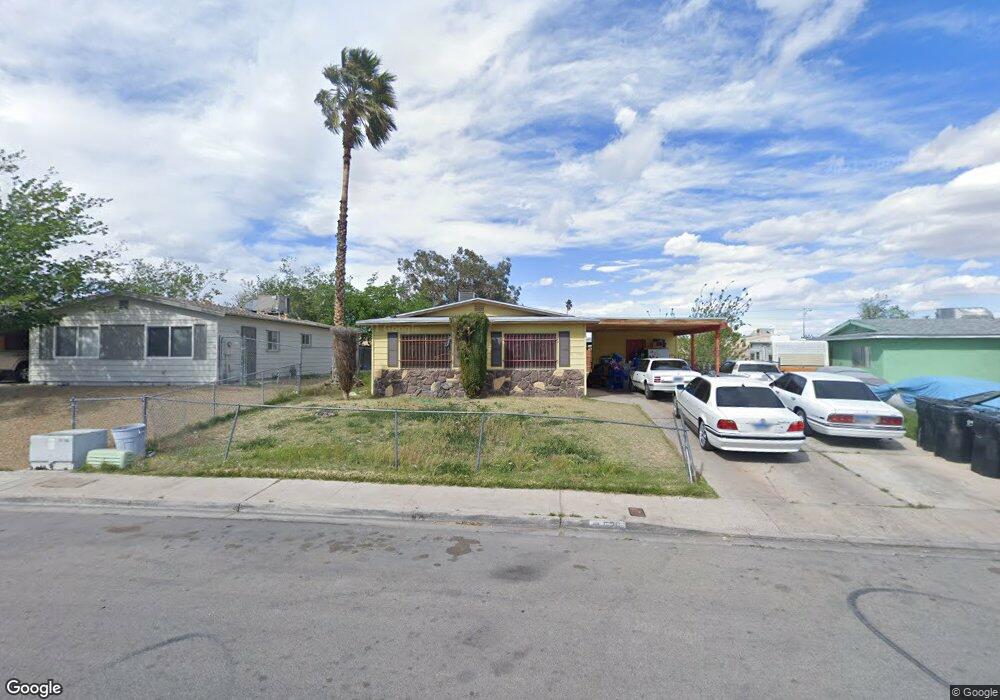
520 Kings Ave North Las Vegas, NV 89030
Downtown North Las Vegas NeighborhoodEstimated Value: $286,828 - $319,000
4
Beds
2
Baths
1,152
Sq Ft
$263/Sq Ft
Est. Value
About This Home
This home is located at 520 Kings Ave, North Las Vegas, NV 89030 and is currently estimated at $302,957, approximately $262 per square foot. 520 Kings Ave is a home located in Clark County with nearby schools including H.P. Fitzgerald Elementary School, West Prepatory Academy At Charlles I West Hall Sec, and Canyon Springs High School And The Leadership And.
Ownership History
Date
Name
Owned For
Owner Type
Purchase Details
Closed on
Jun 16, 2022
Sold by
Tradean Cross
Bought by
Cross Tradean and Cross-Toney Arneshia
Current Estimated Value
Create a Home Valuation Report for This Property
The Home Valuation Report is an in-depth analysis detailing your home's value as well as a comparison with similar homes in the area
Home Values in the Area
Average Home Value in this Area
Purchase History
| Date | Buyer | Sale Price | Title Company |
|---|---|---|---|
| Cross Tradean | -- | None Listed On Document |
Source: Public Records
Tax History Compared to Growth
Tax History
| Year | Tax Paid | Tax Assessment Tax Assessment Total Assessment is a certain percentage of the fair market value that is determined by local assessors to be the total taxable value of land and additions on the property. | Land | Improvement |
|---|---|---|---|---|
| 2025 | $448 | $41,926 | $26,600 | $15,326 |
| 2024 | $448 | $41,926 | $26,600 | $15,326 |
| 2023 | $448 | $42,190 | $28,350 | $13,840 |
| 2022 | $456 | $30,010 | $17,640 | $12,370 |
| 2021 | $423 | $28,998 | $17,500 | $11,498 |
| 2020 | $389 | $29,352 | $17,500 | $11,852 |
| 2019 | $365 | $23,621 | $11,550 | $12,071 |
| 2018 | $348 | $21,735 | $9,800 | $11,935 |
| 2017 | $722 | $21,526 | $9,100 | $12,426 |
| 2016 | $328 | $19,152 | $5,950 | $13,202 |
| 2015 | $325 | $18,271 | $4,900 | $13,371 |
| 2014 | $316 | $12,318 | $3,500 | $8,818 |
Source: Public Records
Map
Nearby Homes
- 704 Kings Ave
- 433 Duchess Ave
- 00 Rossmoyne Ave
- 0 Rossmoyne Ave
- 400 Rossmoyne Ave
- 0 Windsor St Unit 2693785
- 508 Sand Sage Ave
- 00 Duquesne Ave
- 4 Duquesne Ave
- 309 Rossmoyne Ave
- 301 Lance Ave
- 0 Reverend Wilson Ave Unit 2710235
- 0 Reverend Wilson Ave Unit 2708306
- 0 Reverend Wilson Ave Unit 2698097
- 0 Reverend Wilson Ave Unit 2672237
- 0 Reverend Wilson Ave Unit 2656872
- 0 Miller Steet
- 0 Miller Streeet
- 0 Miller Ave
- 725 Miller Ave