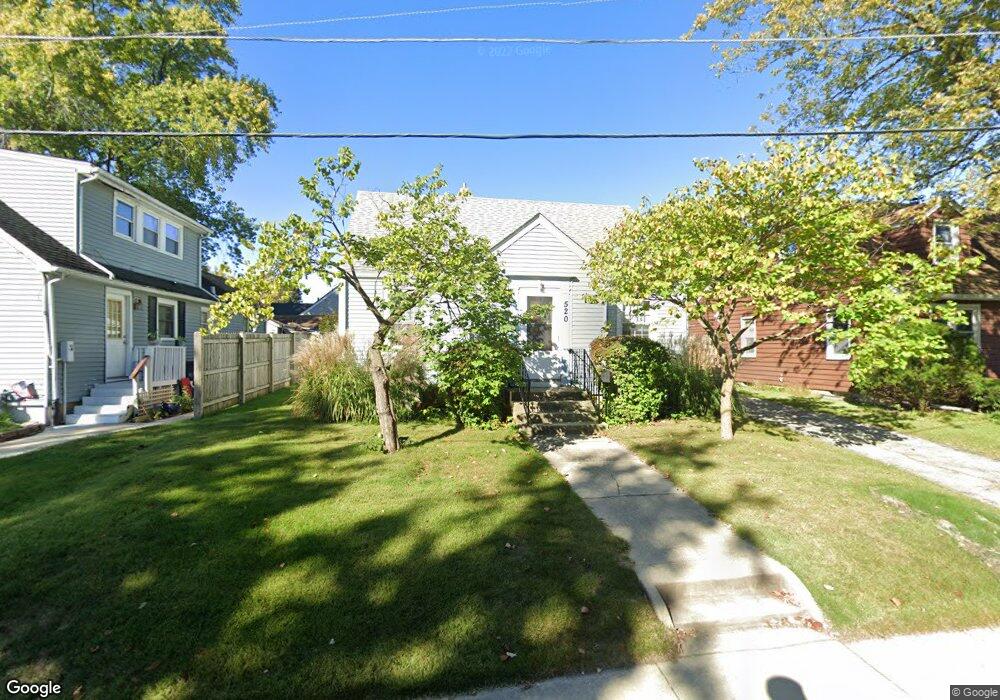
520 Lindberg Ct Elgin, IL 60123
Southwest Elgin NeighborhoodEstimated Value: $236,056 - $299,000
About This Home
This home is located at 520 Lindberg Ct, Elgin, IL 60123 and is currently estimated at $264,014, approximately $201 per square foot. 520 Lindberg Ct is a home located in Kane County with nearby schools including Lowrie Elementary School, Abbott Middle School, and Larkin High School.
Ownership History
We collect this data history from publicly available records. To have your information removed, we recommend requesting removal directly through your county’s website.
Purchase Details
Purchase Details
Home Financials for this Owner
Home Financials are based on the most recent Mortgage that was taken out on this home.Purchase Details
Purchase Details
Home Values in the Area
Average Home Value in this Area
Purchase History
We collect this data history from publicly available records. To have your information removed, we recommend requesting removal directly through your county’s website.
| Date | Buyer | Sale Price | Title Company |
|---|---|---|---|
| -- | None Listed On Document | ||
| $178,000 | Chicago Title Insurance Comp | ||
| -- | -- | ||
| -- | -- |
Mortgage History
We collect this data history from publicly available records. To have your information removed, we recommend requesting removal directly through your county’s website.
| Date | Status | Borrower | Loan Amount |
|---|---|---|---|
| Previous Owner | $128,000 |
Tax History
We collect this data history from publicly available records. To have your information removed, we recommend requesting removal directly through your county’s website.
| Year | Tax Paid | Tax Assessment Tax Assessment Total Assessment is a certain percentage of the fair market value that is determined by local assessors to be the total taxable value of land and additions on the property. | Land | Improvement |
|---|---|---|---|---|
| 2024 | $3,982 | $65,758 | $12,722 | $53,036 |
| 2023 | $3,700 | $59,407 | $11,493 | $47,914 |
| 2022 | $3,743 | $54,169 | $10,480 | $43,689 |
| 2021 | $3,537 | $50,644 | $9,798 | $40,846 |
| 2020 | $3,406 | $48,348 | $9,354 | $38,994 |
| 2019 | $3,274 | $46,054 | $8,910 | $37,144 |
| 2018 | $3,005 | $41,396 | $8,394 | $33,002 |
| 2017 | $2,894 | $39,134 | $7,935 | $31,199 |
| 2016 | $3,232 | $36,306 | $7,362 | $28,944 |
| 2015 | -- | $33,278 | $6,748 | $26,530 |
| 2014 | -- | $32,867 | $6,665 | $26,202 |
| 2013 | -- | $33,734 | $6,841 | $26,893 |
Map
- 515 Oak St
- 720 Adams St
- 618 Washburn St
- 571 Walnut Ave
- 515 Walnut Ave
- 315 Vandalia St
- 410 Standish St
- 216 Wilcox Ave
- 361 S Commonwealth Ave
- 551 Sunset Dr
- 525 Sunset Dr
- 219 Walter Ct
- 468 Locust St
- 903 Erie St
- 1106 Birchdale Dr
- 51 Wilcox Ave
- 270 S Melrose Ave
- 519 W Highland Ave
- 161 S Grove Ave
- 8 Monroe St
Ask me questions while you tour the home.