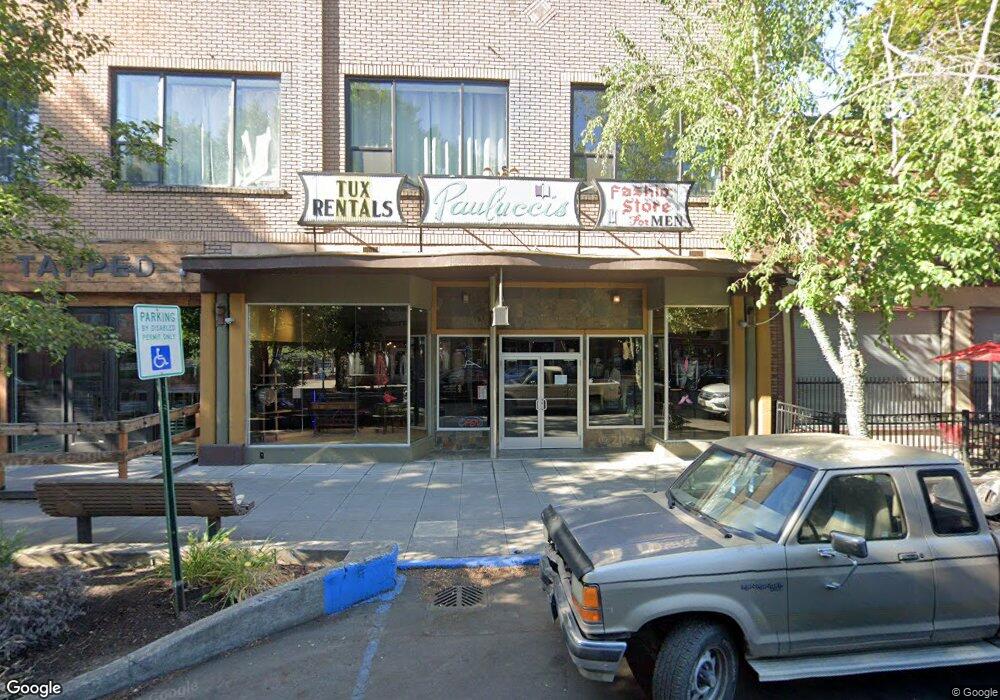
520 Main St Lewiston, ID 83501
Estimated Value: $657,360
--
Bed
--
Bath
14,467
Sq Ft
$45/Sq Ft
Est. Value
About This Home
This home is located at 520 Main St, Lewiston, ID 83501 and is currently estimated at $657,360, approximately $45 per square foot. 520 Main St is a home located in Nez Perce County with nearby schools including Webster Elementary School, Lewiston High School, and All Saints Catholic School.
Ownership History
Date
Name
Owned For
Owner Type
Purchase Details
Closed on
Aug 22, 2019
Sold by
Paulucci John and Paulucci Jennifer
Bought by
Asher Martin Re Llc
Current Estimated Value
Purchase Details
Closed on
Aug 6, 2008
Sold by
Paulucci Giacobbe Jack and Paulucci Eva M
Bought by
Paulucci John and Paulucci Jennifer
Home Financials for this Owner
Home Financials are based on the most recent Mortgage that was taken out on this home.
Original Mortgage
$250,000
Interest Rate
4.82%
Mortgage Type
Future Advance Clause Open End Mortgage
Create a Home Valuation Report for This Property
The Home Valuation Report is an in-depth analysis detailing your home's value as well as a comparison with similar homes in the area
Home Values in the Area
Average Home Value in this Area
Purchase History
| Date | Buyer | Sale Price | Title Company |
|---|---|---|---|
| Asher Martin Re Llc | -- | Land Ttl Of Nez Perce Count | |
| Paulucci John | -- | -- |
Source: Public Records
Mortgage History
| Date | Status | Borrower | Loan Amount |
|---|---|---|---|
| Previous Owner | Paulucci John | $250,000 |
Source: Public Records
Tax History Compared to Growth
Tax History
| Year | Tax Paid | Tax Assessment Tax Assessment Total Assessment is a certain percentage of the fair market value that is determined by local assessors to be the total taxable value of land and additions on the property. | Land | Improvement |
|---|---|---|---|---|
| 2025 | $20,948 | $1,406,923 | $131,323 | $1,275,600 |
| 2024 | $105 | $1,398,927 | $118,527 | $1,280,400 |
| 2023 | $21,755 | $1,398,252 | $107,752 | $1,290,500 |
| 2022 | $7,276 | $410,210 | $93,610 | $316,600 |
| 2021 | $7,522 | $381,955 | $84,855 | $297,100 |
| 2020 | $7,139 | $361,280 | $74,080 | $287,200 |
| 2019 | $6,353 | $293,161 | $74,080 | $219,081 |
| 2018 | $6,406 | $293,161 | $74,080 | $219,081 |
| 2017 | $5,509 | $0 | $0 | $0 |
| 2016 | $5,509 | $0 | $0 | $0 |
| 2015 | $5,485 | $0 | $0 | $0 |
| 2014 | $5,421 | $274,080 | $74,080 | $200,000 |
Source: Public Records
Map
Nearby Homes