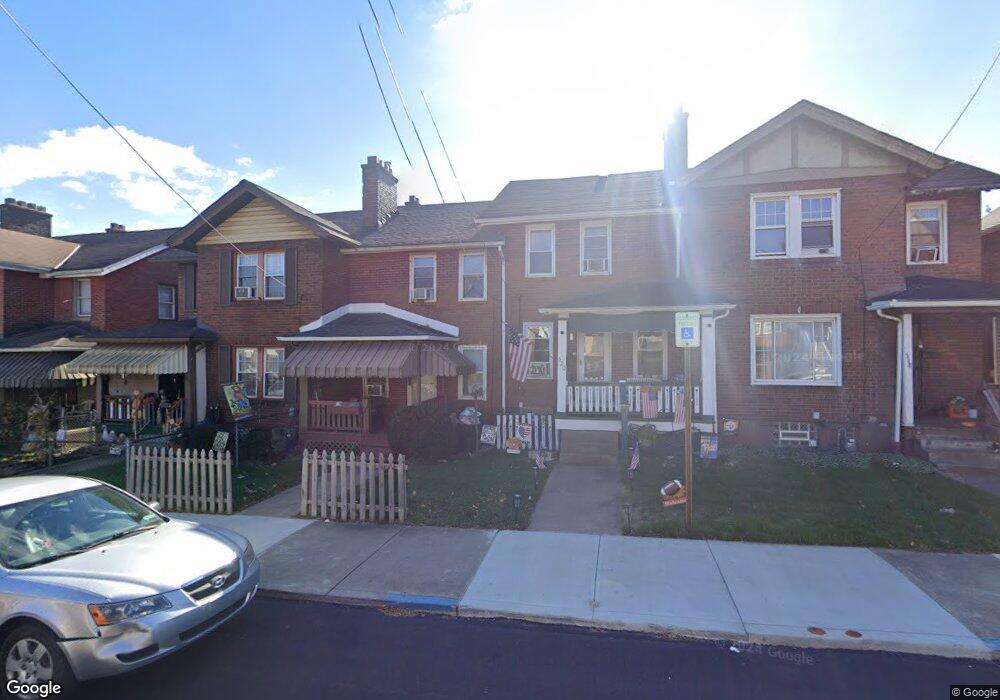
520 Maple St East Pittsburgh, PA 15112
Estimated Value: $54,000 - $60,145
2
Beds
1
Bath
884
Sq Ft
$64/Sq Ft
Est. Value
About This Home
This home is located at 520 Maple St, East Pittsburgh, PA 15112 and is currently estimated at $56,536, approximately $63 per square foot. 520 Maple St is a home located in Allegheny County with nearby schools including Woodland Hills Senior High School, Braddock Hills High School, and Propel Cs-East.
Ownership History
Date
Name
Owned For
Owner Type
Purchase Details
Closed on
Aug 30, 2006
Sold by
Joscak David
Bought by
Dreshman Ronald P
Current Estimated Value
Home Financials for this Owner
Home Financials are based on the most recent Mortgage that was taken out on this home.
Original Mortgage
$31,407
Outstanding Balance
$19,025
Interest Rate
6.83%
Mortgage Type
FHA
Estimated Equity
$37,511
Purchase Details
Closed on
May 10, 2002
Sold by
Yurko Helen L
Bought by
Joscak Teri
Purchase Details
Closed on
Aug 25, 1997
Sold by
Edinger Margaret M and Edinger John Patrick
Bought by
Yurko Charles and Yurko Helen L
Create a Home Valuation Report for This Property
The Home Valuation Report is an in-depth analysis detailing your home's value as well as a comparison with similar homes in the area
Home Values in the Area
Average Home Value in this Area
Purchase History
| Date | Buyer | Sale Price | Title Company |
|---|---|---|---|
| Dreshman Ronald P | $31,900 | -- | |
| Joscak Teri | -- | -- | |
| Yurko Charles | $12,000 | -- |
Source: Public Records
Mortgage History
| Date | Status | Borrower | Loan Amount |
|---|---|---|---|
| Open | Dreshman Ronald P | $31,407 |
Source: Public Records
Tax History Compared to Growth
Tax History
| Year | Tax Paid | Tax Assessment Tax Assessment Total Assessment is a certain percentage of the fair market value that is determined by local assessors to be the total taxable value of land and additions on the property. | Land | Improvement |
|---|---|---|---|---|
| 2025 | $36 | $800 | $800 | -- |
| 2024 | $36 | $800 | $800 | -- |
| 2023 | $36 | $800 | $800 | $0 |
| 2022 | $36 | $800 | $800 | $0 |
| 2021 | $33 | $800 | $800 | $0 |
| 2020 | $35 | $800 | $800 | $0 |
| 2019 | $35 | $800 | $800 | $0 |
| 2018 | $4 | $800 | $800 | $0 |
| 2017 | $35 | $800 | $800 | $0 |
| 2016 | $4 | $800 | $800 | $0 |
| 2015 | $4 | $800 | $800 | $0 |
| 2014 | $33 | $800 | $800 | $0 |
Source: Public Records
Map
Nearby Homes